iPhone Vs. Android User Stats: Key Highlights
-
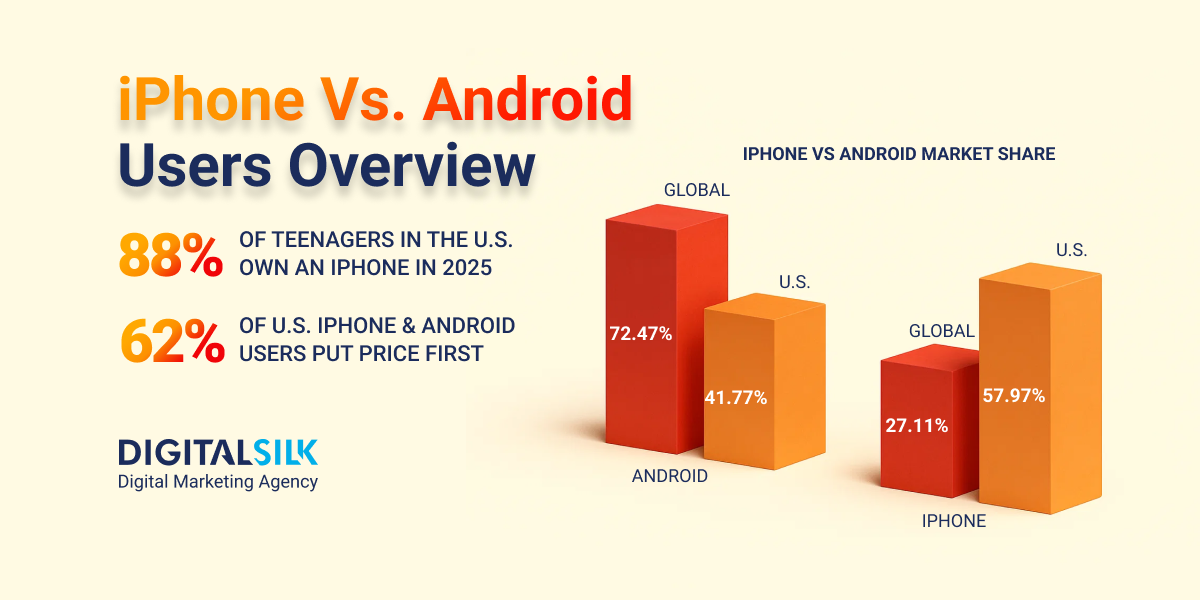
Android holds 72.47% of the global smartphone market in 2025, while iOS accounts for 27.11%.
-
In the U.S., iOS leads with 57.97% smartphone market share, totaling 155 million iPhone users in 2024.
-
Global in-app purchase revenue across iOS and Google Play reached $150 billion in 2024, marking a 13% year-over-year increase.
Before you even finish reading this sentence, your potential customers will make dozens of micro-decisions on their iPhones or Androids, each one a missed or captured opportunity for your brand.
With 71% of the global population now using smartphones, these quick, instinctive actions are shaping revenue, engagement and long-term brand preference more than most boardroom strategies ever will.
Every swipe, tap and pause holds signals about what drives action and what gets ignored.
In this post, we’ll break down the latest iPhone vs Android user stats and show how these insights can help you capture audience attention when it matters most.
Android Vs iPhone Market Share Worldwide
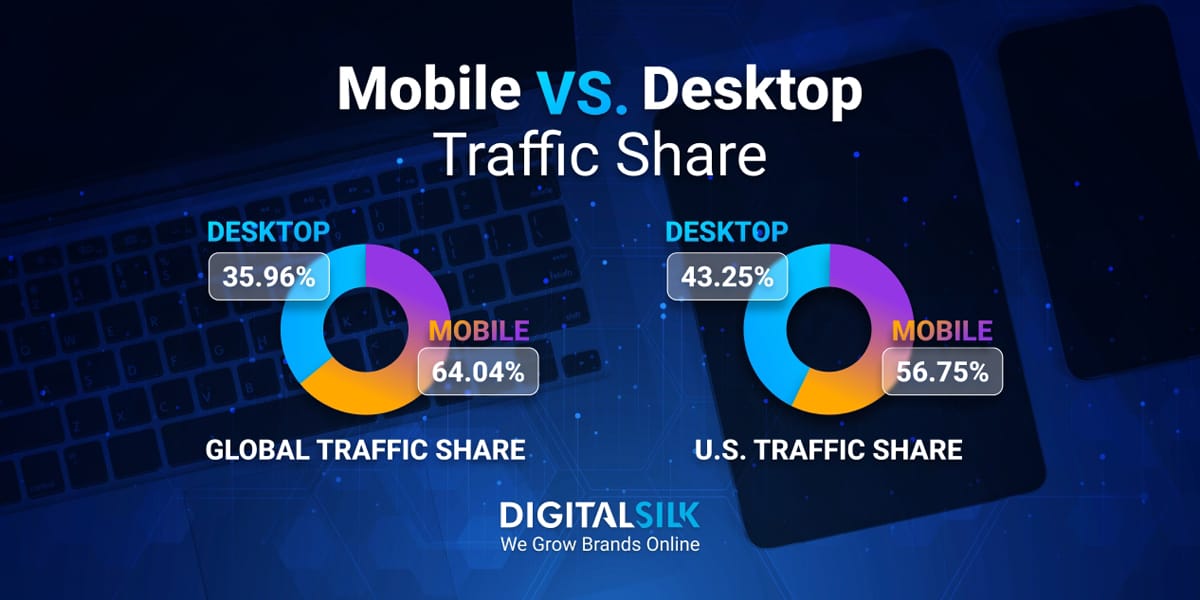
Mobile traffic continues to climb year after year, reshaping how brands approach digital engagement, advertising and customer experience.
Understanding how many people have iPhones vs Android in the world plays a direct role in shaping ad strategies, user experience priorities and platform-specific investments.
The data below highlights where usage is growing, how device distribution is changing and what that means for audience targeting across both mobile and tablet users.
- In 2025, the global mobile operating system market was valued at $54.51 billion, up from $51.31 billion in 2024.
- Projections suggest it will reach $74.72 billion by 2030 with a 6.46% CAGR.
- Based on the 2026 Android vs iOS market share on mobile devices, Android increased slightly from 2024 to reach 72.69%, with iOS holding steady at 26.91%.
- However, the global Android vs Apple market share for tablets tells a different story, with iOS slightly ahead at 50.72% and Android close behind at 49.08%.
- Android’s global reach now includes more than 3 billion active devices across more than 190 countries.
- Apple’s active devices exceeded 2.3 billion for the first time in fiscal 2025 Q1, representing the largest footprint in its history.
What These Numbers Mean For You
- Platform-specific UX drives performance. With billions of active devices across both ecosystems, one-size-fits-all campaigns are becoming less effective. From ad targeting to feature prioritization, aligning user experiences with device behavior leads to more effective engagement and higher conversion rates.
- Mobile-first experience design is no longer optional. The continued growth in mobile traffic underscores the need for fast-loading, mobile-optimized content that performs well across both Android and iOS devices.
- Tablet behavior creates new engagement moments. The closer split between Android and iOS in the tablet space offers fresh opportunities for brands to tailor experiences for larger screens, especially in content consumption and eCommerce.
Apple Vs. Android Market Share In The U.S.
As smartphone adoption reaches near-total saturation, one question keeps shaping marketing and product decisions: are there more Android or iPhone users in the U.S.?
Shifts in user base, tablet ownership and connection technology like eSIM are offering new insights into how people engage with mobile devices.
The data below highlights current adoption patterns, platform usage trends and how these shifts are reshaping mobile engagement across the country.
- In 2024, 90% of Americans owned a smartphone, reflecting widespread mobile adoption.
- Among these users, the iOS vs Android market share in the U.S. favors iOS at 58.21%, while Android holds 41.52%, in contrast to global figures where Android maintains a significant lead.
- The 2026 tablet market saw iOS holding 55.19% and Android 44.63%, highlighting a much closer competition than the iPhone vs Android market share observed in smartphones.
- The total number of iPhone users in the U.S. hit 155 million in 2024.
- North America leads in eSIM adoption, driven largely by Apple’s launch of eSIM-only iPhones in the U.S. in 2022, with 50% of smartphone connections in the region using an eSIM by the end of 2025.
What These Numbers Mean For You
- iOS dominance should influence U.S. targeting strategies. With iOS leading smartphone market share, campaigns aimed at American consumers may see stronger returns when optimized for iPhone users first. For your U.S.-based audience, prioritize iPhone-first messaging, UX design and ad buys for superior reach before optimizing for Android.
- Audience segmentation by device type will improve personalization. Knowing which platform your U.S. audience uses enables better messaging, app feature prioritization and conversion tracking.
- Apple’s large installed base offers unique retention and upsell opportunities. With over 155 million iPhone users, lifecycle marketing and upgrade-focused offers can drive incremental revenue, especially around device launches and trade-in programs.
iPhone Vs. Android Sales Overview
iPhone vs Android user stats tell a bigger story than just who is buying what.
They reveal how long people hold onto their devices, how quickly they adopt new models and which price points are driving volume.
With flagship launches, shifting upgrade cycles and widening price gaps between platforms, the sales data offers a clear view into changing consumer priorities.
- Apple led global device shipments in 2024 with 232.1 million units, followed closely by Samsung, the top Android vendor, at 223.4 million.
- Apple reported fiscal Q1 2025 revenue of $124.3 billion, a 4% increase year over year, with diluted earnings per share rising 10% to $2.40.
- For Q1 2025, Samsung achieved its highest-ever quarterly revenue of $55.27 billion, supported by solid Galaxy S25 sales and growth in high-value product segments.
- In the U.S., Apple dominated the 2024 smartphone market with 57.39%, while Samsung held second place with 23.27%.
- In 2025, the average cost of an Android smartphone worldwide was $293, while iPhones command a much higher average price of $1.048.
- By 2029, both Android and iPhone prices are projected to drop slightly, with Android devices averaging $287 and iPhones expected to fall to $1.015.
- The iPhone 16 was the world’s top-selling smartphone in the third quarter of 2025, with the iPhone 16 Pro and iPhone 16 Pro Max following in second and third place, respectively.
- The best-selling Android phone on the list was the Samsung Galaxy A16 5G in fifth place, while the brand’s flagship S-series wasn’t in the top 10, despite the S24 Ultra taking the tenth spot the year before.
- 70% of iPhone buyers in 2024 owned phones that were two years old or more, up slightly from 66% the year before.
- In contrast, 57% of Android phones are retired within two years, reflecting a much faster turnover rate compared to iPhones.
- As of June 2025, iOS 18 adoption stands at 88% for iPhones released within the last four years and 82% across all iPhones ever produced.
- At the end of 2025, Android 15 led the global Android OS market with a 30.09% share, followed by Android 13 at 15.04%.
- Despite being the latest version, Android 16 holds a relatively modest 4.66% adoption rate after its June 2025 release.
What These Numbers Mean For You
- Longer iPhone ownership cycles create opportunities for service-based revenue. With more users holding onto their devices for two years or longer, there’s growing potential to drive revenue through accessories, extended warranties and subscription-based services.
- Android’s faster device turnover creates more frequent upgrade touchpoints. Brands selling trade-in programs, financing plans or mobile services can lean into Android users’ shorter replacement patterns to boost conversion timing.
- Top-selling devices shape UX design decisions. Knowing which models dominate the market helps inform everything from screen size optimization to hardware capability testing for app and web development teams.
Android Vs Apple Users App Spending and Engagement
App engagement and spending have become major revenue engines, with user behavior inside app stores now driving year-over-year growth for both platforms.
Shifts in how people discover, download and pay for apps are giving developers and businesses new signals on where user attention is going.
The data below highlights key trends in app availability, download volume and in-app revenue growth across Google Play and the App Store.
- A key difference for iPhone vs Android users is that Google Play hosts just over 2 million apps with 96.95% of them being free, while the App Store offers 1.9 million apps, with free ones accounting for 95.4%.
- In 2024, global in-app purchase (IAP) revenue across iOS and Google Play reached $150 billion for the first time, marking a 13% year-over-year increase and the highest growth rate since 2021.
- Global app downloads across iOS and Google Play remained flat at 136 billion, but user engagement grew as the average person used 26 apps per month with a 9.2 percent increase and 7 unique apps each day.
- In February 2025, TikTok was the most-downloaded app worldwide on the Google Play Store, with nearly 65 million downloads from Android users, followed by WhatsApp with around 41 million downloads.
- In the same period, DeepSeek was the most-downloaded app on the App Store with around 21 million iPhone downloads, while ChatGPT ranked second with approximately 16.4 million.
- Both the Apple App Store and Google Play Store charge a standard commission rate of 30% on app sales and in-app purchases worldwide.
What These Numbers Mean For You
- High engagement creates more revenue opportunities beyond downloads. With users now interacting with more apps per day and month, there’s increased potential for monetization through in-app purchases, subscriptions and ad placements.
- Platform-specific app preferences should guide channel planning. The dominance of TikTok on Google Play and DeepSeek on the App Store shows that content, advertising and partnerships may perform differently depending on platform-specific user trends.
- Flat download growth shifts the focus to retention and lifetime value. With download volume leveling off, brands need to double down on user engagement strategies that increase app stickiness and repeat usage.
Apple Vs. Android Users Demographics & Trends
Today’s smartphone habits are shaped by everything from generational preferences to price sensitivity and privacy concerns.
Trends in device satisfaction, ecosystem loyalty and even attitudes toward AI features are giving businesses a clearer view of what drives user decisions.
The iPhone vs Android user stats below highlight the demographic patterns and behavioral signals influencing mobile engagement.
- Global mobile data traffic reached 139 exabytes per month in 2025 and is expected to nearly double to 274 exabytes per month by 2030.
- 79% of American Gen Z smartphone users favor Apple, with Samsung trailing at 13%, suggesting a likely boost to the current U.S. iPhone market share over time.
- 88% of teenagers in the U.S. are already iPhone users in 2025, while 25% of them are expected to move to the iPhone 17 in the fall.
- 79% of iPhone users in the U.S. have an Apple Watch as their smartwatch or fitness tracker, compared to just 22% of Android users, highlighting the stronger pull of Apple’s ecosystem.
- 62% of Android and iPhone users in the U.S. cite price as the top consideration for their smartphone upgrade.
- 50% of U.S. Apple and Android users aren’t willing to pay a monthly subscription for AI features on their phones.
- Just over 40% of those consumers were concerned about privacy when using AI on their devices in 2025, up 7% from 2024.
- This concern spans all age groups, with 45% of Boomers and 41% of both Gen Z and Gen X users expressing worry.
- In 2025, Samsung topped U.S. smartphone satisfaction with a score of 82, just ahead of Apple at 81, while LG and Motorola (both Android) scored 77.
- 75% of users worldwide list chatting or sending messages as their top smartphone activity.
- 52% of Android users would switch to iOS due to its better functionality.
- 16.7% of Android users say they have less respect for iPhone owners, but an even higher 27.2% of iPhone users say the same about those on Android.
- 42% of consumers say Apple Intelligence is an extremely or very important feature for their next iPhone, with the percentage increasing to 54% among those planning to upgrade within the next 12 months.
- Push notifications perform better on Android, with a 5.3% click-through rate compared to 2.75% on iOS, largely due to Apple’s opt-in requirement for notifications.
- Smartphone dependency in 2024 was highest among U.S. users aged 18–29 at 21%, with an unexpected 17% of adults aged 65+ also showing dependency.
- 15% of U.S. adults are considered ‘smartphone-only’ internet users, meaning they own a smartphone but do not subscribe to home broadband service.
What These Numbers Mean For You
- Generational loyalty will shape future market share. With Gen Z and teen adoption overwhelmingly favoring iPhones, Apple’s lead in younger demographics signals long-term momentum for iOS in the U.S.
- Price sensitivity remains a powerful driver across both audiences. With 62% of users citing price as their top upgrade factor, brands offering financing plans, trade-in deals or lower-cost models can better capture upgrade intent.
- Privacy and AI adoption are emerging as deal-breakers. Rising consumer concern over AI-related privacy issues could influence feature adoption rates, opt-in behaviors and even future device sales.
Optimize Mobile Experiences With Digital Silk
Optimizing for mobile means aligning with how people browse, engage and convert across different devices and platforms.
With user behavior shifting rapidly, data-driven design and responsive development are key to turning mobile traffic into business results.
Digital Silk’s experienced web designers and developers build tailored, high-performance mobile experiences that meet both audience expectations and strategic objectives.
As a professional web design agency, our services include:
With each project, Digital Silk prioritizes proactive planning and ongoing, honest communication to produce results that matter.
Contact our team, call us at (800) 206-9413 or fill in the Request a Quote form below to schedule a consultation.
"*" indicates required fields


