How Much eCommerce Companies Make: Key Highlights
-
Experience is the differentiator: Brands that go beyond transactions with content, community and personalization stand out in crowded markets.
-
Market leaders dominate revenue: Giants like Walmart and Amazon consistently capture the largest share of eCommerce revenue, leaving most retailers to compete for what’s left.
-
Technology amplifies competitiveness: AI, automation and advanced analytics increasingly separate scalable players from those struggling to keep pace.
Enterprises are pouring billions into eCommerce, yet only a handful of companies capture the lion’s share of online spending.
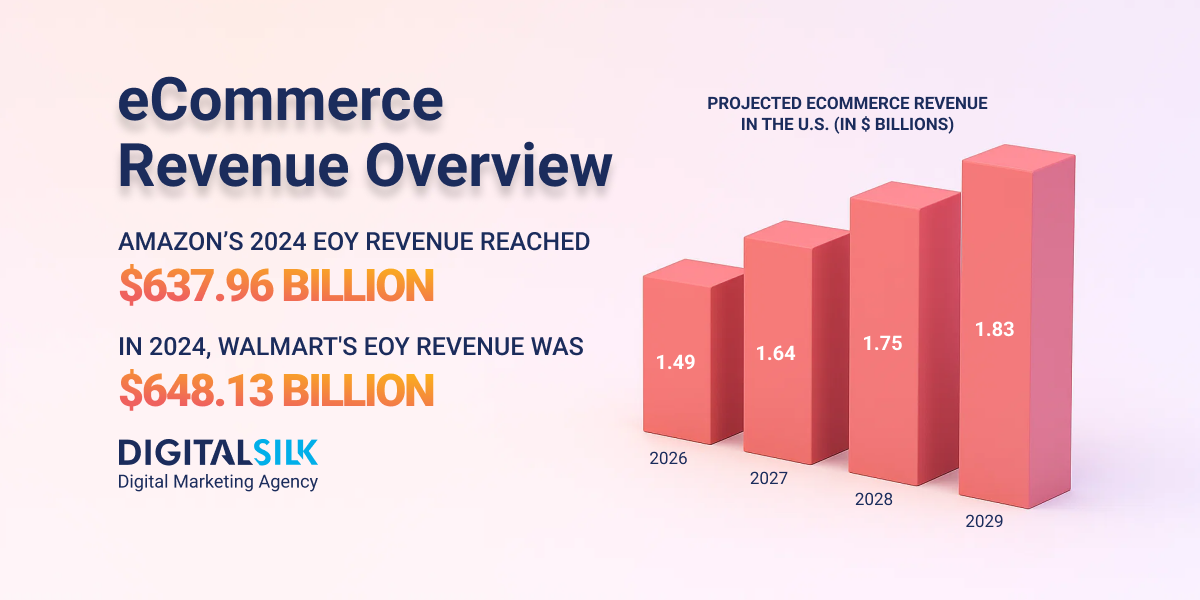
The U.S. eCommerce market is projected to reach $1.83 trillion by 2029, but most retailers struggle to translate growth into sustainable profit.
This guide breaks down how much top eCommerce companies make and more importantly, what senior executives can learn from their models to benchmark growth, estimate income potential and build scalable digital retail strategies.
How Much Can Top eCommerce Companies Make?
The eCommerce net worth of the top players shows how thoroughly digital retail has transformed global commerce.
Below, we’ll break down how much eCommerce companies make and what drives their momentum.
1. Amazon
2024 end-of-year (EOY) revenue: $637.96 billion
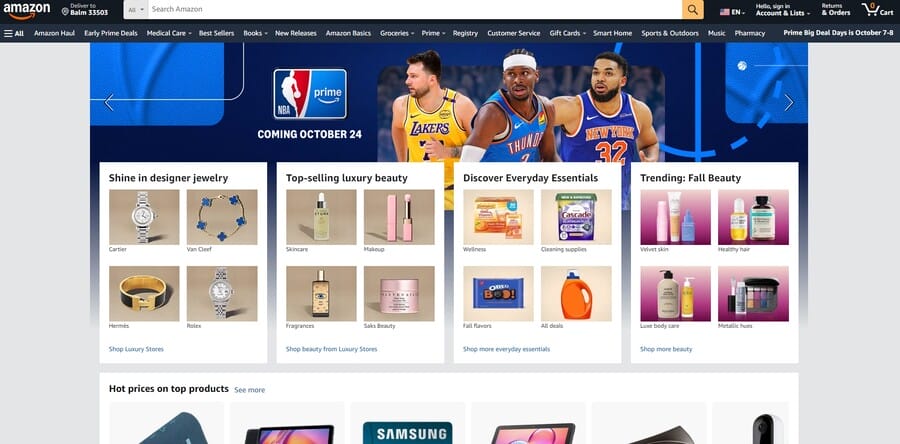
Amazon leads eCommerce sales in the U.S. with $492.23 billion, setting a benchmark that competitors struggle to approach.
Its fulfillment network links thousands of facilities with real-time inventory systems, allowing rapid delivery without inflating costs.
Fulfillment by Amazon extends this infrastructure to third-party sellers, giving them reach while strengthening Amazon’s own ecosystem.
Amazon Web Services (AWS) and its advertising subsectors generate steady, high-margin revenue that balances the volatility of retail margins.
With a market cap of $2.485 trillion in the first half of 2025, Amazon operates less like a store and more like the backbone of global commerce.
Strategic Lesson
Amazon shows that growth is more than just about traffic volume.
It’s also about building an infrastructure that guarantees customer trust.
For enterprises, the lesson is that logistics and fulfillment speed are as critical to revenue as marketing or acquisition.
2. Walmart
2024 EOY revenue: $648.13 billion

Walmart has turned its nationwide store base into a powerful engine for eCommerce growth, supporting a market cap of $819.80 billion in the first half of 2025.
By using its extensive network of stores as same-day fulfillment hubs, it reaches 93% of U.S. households with same-day delivery while keeping delivery costs low.
Its third-party seller platform has expanded quickly, bringing in a wider range of products and increasing revenue through retail media from suppliers and brands.
These efforts are steadily improving Walmart’s online store profit, supported by ongoing investments in robotics, adaptive search and AI-driven tools that make operations more efficient for both employees and customers.
Strategic Lesson
Walmart demonstrates that physical scale, when paired with technology, can be as powerful as a purely digital strategy.
By reimagining its stores as logistics hubs and layering on AI-driven efficiencies, it turns legacy infrastructure into a competitive edge that fuels sustainable eCommerce growth.
3. Alibaba
March 2025 fiscal year earnings: $137.3 billion

Alibaba, with a market cap of about $392.85 billion in the first half of 2025, has consolidated its domestic and international eCommerce platforms into one group to align product development, seller services and logistics under a single strategy.
Through Cainiao it has introduced automated warehouses and regional distribution hubs in Southeast Asia, cutting delivery times while adapting checkout and payment flows to local habits.
If you’re asking how much do top eCommerce businesses make a year, Alibaba provides a clear answer by showing how cross-border infrastructure and localized execution can sustain growth at massive scale.
Its decision to open direct channels for Tmall merchants into overseas markets reflects a push to expand global reach without requiring sellers to build their own international operations.
Strategic Lesson
Alibaba illustrates how scale in eCommerce depends on more than marketplace size.
By unifying its platforms and investing in logistics that respect regional differences, it demonstrates that cross-border growth stems from combining global infrastructure with local adaptability.
4. Apple eCommerce
2024 EOY net sales: $48.8 billion

Apple, with a market cap of $3.603 trillion in the first half of 2025, has turned its eCommerce channel into a key engine within a much larger ecosystem where hardware, software and services reinforce each other.
The online store drives massive demand during product launches, often selling out high-demand devices within hours while setting pricing and inventory expectations for retail partners worldwide.
It also generates recurring revenue through accessories, trade-in programs and extended warranties, keeping customers engaged well after the initial sale.
By controlling every element from supply chain to digital storefront, Apple sustains premium pricing and some of the highest margins in global retail.
Strategic Lesson
Apple uses its online store as a command center for the entire ecosystem, shaping demand during launches, directing partner channels and extending customer lifetime value through services and accessories.
eCommerce here is less about distribution scale and more about preserving control, sustaining margins and reinforcing the brand’s global dominance.
5. Shein
2024 EOY net sales: $48.24 billion
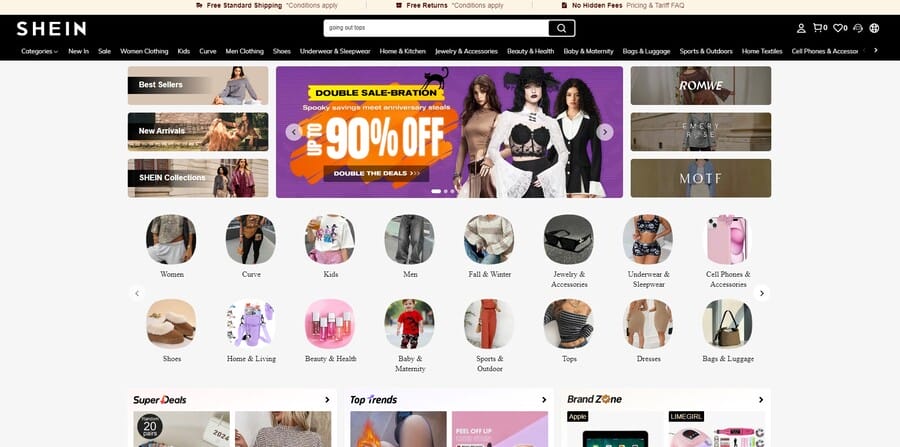
Shein has grown by selling ultra-fast fashion at very low price points, pushing out new styles daily to tap into trends before competitors can react.
But those very practices are under pressure from rising costs in shipping, tighter trade regulations like the removal of “de minimis” exemptions in key markets and scrutiny over environmental and labor practices.
For anyone asking how much can you make from eCommerce at scale, Shein’s growing net sales show the answer lies in massive product volume and relentless speed rather than high margins on individual items.
Its recent sustainability report shows transport emissions rose significantly, prompting efforts to localize production and shift freight modes to cut both emissions and costs.
Strategic Lesson
Shein built its eCommerce dominance on speed and volume, turning trend responsiveness into a competitive weapon.
That same model now faces limits as regulation, costs and sustainability pressures force a shift toward localized production and more resilient operations.
For enterprises, rapid growth strategies must be balanced with adaptability when external conditions tighten.
6. Carvana
2024 EOY revenue: $13.67 billion
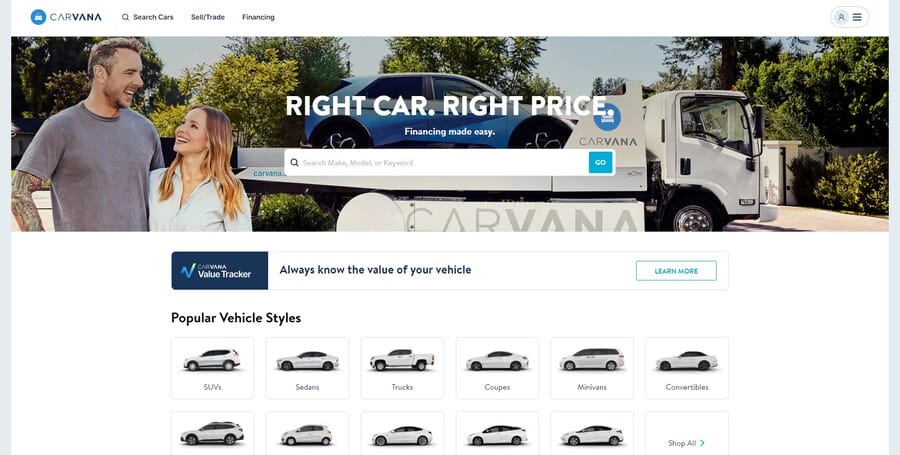
Carvana was the fastest growing eCommerce company in the U.S. in 2024 with a 22.7% annual growth, driven by consumer demand for used vehicles and a streamlined digital process.
With a market cap of $45.83 billion in the first half of 2025, the company manages reconditioning, delivery logistics and financing in-house, creating smoother user journeys while strengthening control over margins.
Its model is a strong example of how much money big online stores can make from eCommerce when high-ticket products are paired with efficient operations and nationwide reach.
An expanding EV inventory and steady improvements in profitability show how disciplined execution can turn growth into long-term preference and market authority.
Strategic Lesson
Carvana demonstrates how eCommerce growth can come from pairing high-value products with full control of the customer journey.
By managing logistics, financing and reconditioning under one roof, it transforms complexity into efficiency and strengthens margins.
Scaling this model with EVs positions the company to convert rapid growth into lasting market leadership.
7. Zalando
2024 EOY revenue: $12.44 billion
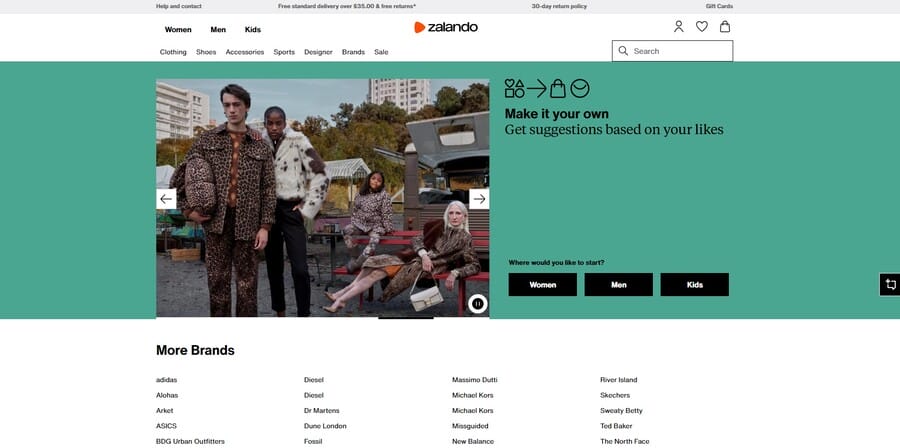
Zalando, with a market cap near $8.07 billion as of mid-2025, is expanding its position in Europe by combining direct-to-consumer fashion sales with a growing business-to-business service arm called ZEOS that helps brands and retailers manage eCommerce operations.
Its growth in gross merchandise volume and active customers has been supported by AI-powered recommendations and faster fulfilment, which are becoming key differentiators as speed and personalization gain value.
The question of how much does eCommerce make a year for big companies is reflected in Zalando’s approach, where profit is driven by efficiency across the chain from product imagery to localized delivery.
Zalando’s investments in marketing tools for partners, sustainability programs and loyalty programs secure long-term customer relationships rather than one-off purchases.
Strategic Lesson
Zalando extends its role beyond fashion sales by offering services that help brands manage eCommerce more efficiently.
Faster fulfillment and personalized recommendations drive customer growth, while partner tools, sustainability initiatives and loyalty programs build stronger margins and long-term customer commitment.
8. eBay
2024 EOY revenue: $10.28 billion
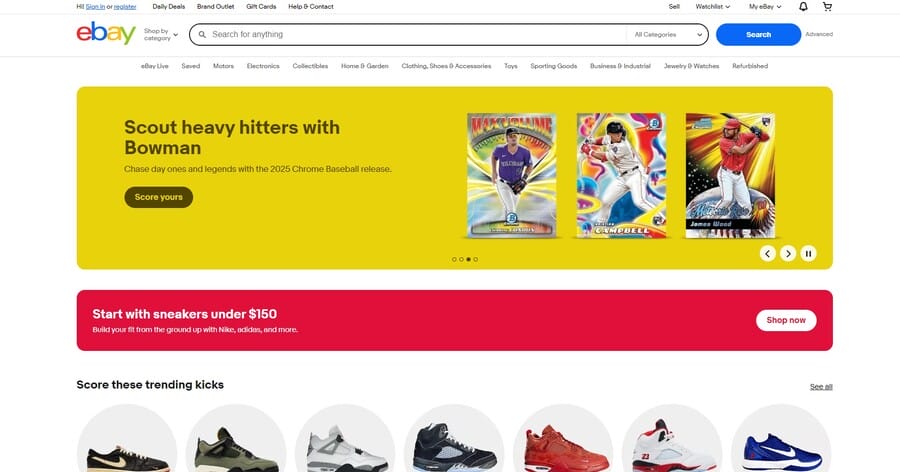
eBay operates as a global marketplace for everything from one-of-a-kind collectibles to everyday goods, supporting a market cap of $41.33 billion in the first half of 2025.
Its platform supports sellers ranging from casual individuals to full-scale small businesses, offering listing tools, reputation systems and built-in advertising to help them reach buyers in over 190 markets.
A strong focus on refurbished and pre-owned items has positioned eBay at the center of the growing circular commerce movement, extending product life cycles while attracting sustainability-minded consumers.
Its mix of transaction fees and advertising revenue allows it to generate steady profit even as market conditions shift.
Strategic Lesson
eBay leverages its marketplace model to serve both casual sellers and established businesses, creating resilience across shifting market conditions.
By leaning into refurbished and pre-owned goods, it captures momentum in circular commerce while sustaining profitability through a blend of transaction and advertising revenue.
9. ASOS
2024 EOY revenue: $2.90 billion

ASOS is pursuing a “Back to Fashion” reset that focuses on tighter stock control, quicker response to new trends and improved customer engagement after a difficult stretch.
The company cut excess inventory significantly and expanded its “Test & React” model, which allows new designs to be developed and listed online in a matter of weeks instead of the traditional months-long cycle.
This approach highlights how much eCommerce companies make when they align efficient product development and inventory management with shifting consumer demand.
With a market cap of about $405 million in the first half of 2025, ASOS is working to recover value by prioritizing discipline over sheer scale.
Strategic Lesson
SOS is stabilizing performance by reducing excess inventory and accelerating design cycles through its “Test & React” model.
Faster product turnover and closer alignment with consumer trends are central to its effort to return to profitability.
For enterprises, the case shows how proper product development and inventory management can be just as important to profitability as marketing or scale.
10. Etsy
2024 EOY revenue: $2.80 billion

Etsy focuses on handmade, vintage and custom goods, carving out space in eCommerce where individuality drives demand.
With a market cap of $6.38 billion in the first half of 2025, it has built a platform that helps small sellers present their products with detailed storefronts, analytics tools and built-in advertising to reach highly targeted buyers.
Policies that emphasize authenticity and originality help protect the marketplace from mass-produced items that could dilute its appeal.
Revenue from transaction fees, listing charges and seller services like advertising and payment processing form the backbone of Etsy’s eCommerce income, keeping the model resilient even when broader demand slows.
Strategic Lesson
Etsy has built strength by focusing on individuality, giving small sellers tools to reach targeted buyers while enforcing policies that preserve authenticity.
This niche positioning keeps demand resilient and margins steady, highlighting how a clear identity and differentiated offering can sustain profitability even in slower markets.
How To Estimate Your eCommerce Income Potential
Estimating online store profit potential requires connecting customer behavior, operational costs and category dynamics into a measurable model.
By breaking projections into clear components and pressure-testing them against benchmarks, it becomes possible to see where growth is realistic and where assumptions may fall short.
The following areas outline the main levers that drive accuracy in revenue modeling:
1. Use Traffic × Conversion × AOV Formula
Revenue can be mapped directly by using the following formula: Revenue = Traffic x Conversion Rate x Average Order Value (AOV).
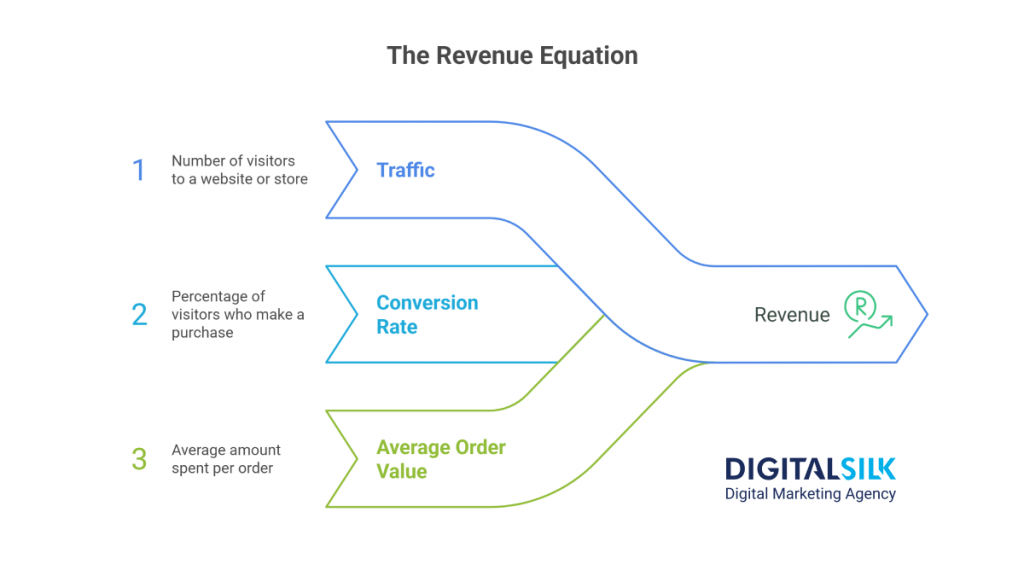
Each key performance indicator (KPI) highlights a different opportunity: more qualified visitors through acquisition, stronger conversion through checkout optimization, or larger orders through bundling and upselling.
With cart abandonment at 70.19%, many companies see faster gains by improving checkout flow than by spending heavily on new traffic.
Running projections with varied assumptions across these levers gives a clearer picture of potential outcomes.
According to Adobe Digital Economy Index, global eCommerce conversion rates average just 2–3%, with top-performing retailers exceeding 4%.
This benchmark helps executives test whether their projections are realistic and identify where conversion optimization may deliver faster ROI than traffic growth.
2. Understand Fixed Vs. Variable Costs
Separating fixed and variable costs provides visibility into how margins change as volume grows.
Fixed expenses such as technology platforms, staff or core warehousing remain stable regardless of order flow, while variable costs like shipping, packaging and payment processing scale directly with demand.
Mapping these out shows the breakeven point and clarifies how sustainable profits look at different sales levels.
3. Benchmark Against Industry Averages
Comparing projections against industry averages helps test whether targets align with how customers actually behave in different sectors.
Professional services see conversion rates near 4.6% while B2B eCommerce is closer to 1.8%, which shows how buyer intent and purchase complexity shape outcomes.
Using these benchmarks keeps projections grounded, preventing overestimation of revenue in categories where decision cycles are longer and conversion naturally runs lower.
They also highlight where a business is outperforming peers and where improvements could have measurable impact.
4. Factor In Niches Vs. Saturated Categories
Niches and saturated categories create very different revenue dynamics.
In saturated markets like electronics or beauty, customer acquisition costs rise quickly, price competition erodes margins and loyalty is harder to build.
Niche categories, such as specialty crafts or targeted professional equipment, tend to draw smaller audiences but deliver higher repeat rates and stronger brand attachment.
Factoring these differences into projections helps show not just how much income an eCommerce business can make, but also what it takes to sustain that income over time.
What Drives eCommerce Company Earnings
Companies with cohesive eCommerce strategies see up to 30% higher revenue growth, while 75% of those excelling in digital commerce have a dedicated team focused on execution and optimization.
The following factors highlight where earnings are most often won or lost:
- Product type and pricing: Margin structures vary widely across categories, so the ability to balance competitive pricing with perceived value often determines whether growth translates into profitability.
- Personalized user experiences: 89% of companies say personalization is invaluable, reflecting how data-driven product recommendations and tailored promotions directly increase order value and long-term retention. Moreover, companies with advanced personalization drive 40% more revenue than peers, which makes this strategy a core revenue-growth lever.
- Traffic and lead generation: Sustainable growth depends on attracting visitors with genuine purchase intent, which requires aligning acquisition channels with buyer behavior rather than simply increasing volume.
- Market size and global reach: Expanding into larger or international markets raises income potential, but only when supported by localized logistics, culturally relevant marketing, and flexible payment options.
- Ad spend efficiency: Measuring the return on ad spend (ROAS) reveals how effectively marketing translates into revenue and continuous optimization prevents rising acquisition costs from eroding margins.
- Platform model: Revenue potential shifts depending on whether the business operates as a marketplace, a direct-to-consumer brand or a software platform, since each carries different cost bases and scalability profiles.
- Operational efficiency and margins: Effective warehousing, fulfillment and supply chain management directly raise profitability and determine whether growth can scale sustainably.
How To Maximize Your eCommerce Revenue
Maximizing revenue is less about adding complexity and more about refining the areas where customer experience and operational performance intersect.
The strategies below highlight where adjustments deliver the strongest impact on income growth:
- Smart product suggestions and personalization: Personalized recommendations informed by browsing and purchase history raise average order value and keep customers engaged longer across sessions.
- Loyalty and rewards programs: 90% of customers are willing to interact with a brand if it offers incentivized engagement, showing how structured rewards can transform one-time buyers into repeat customers.
- Conversion-driven marketing & CRO: Optimizing ads, landing pages, and checkout flows based on data uncovers hidden revenue opportunities by turning more existing traffic into paying customers.
- Efficient operations and automation: Automating fulfillment, inventory updates, and customer support reduces overhead while freeing teams to focus on initiatives that directly grow revenue.
- Customer retention and upselling: Retained customers buy more frequently and at higher values and carefully designed upsell or cross-sell offers capture additional spend without increasing acquisition costs.
Challenges That Limit eCommerce Growth
Even with strong revenue models and well-structured strategies, growth can stall when common hurdles are left unresolved.
These challenges often define whether a company scales efficiently or struggles to sustain momentum:
- Competing in saturated markets: Heavy competition drives up acquisition costs and pushes margins down, requiring sharper differentiation and stronger brand equity to maintain profitability.
- Keeping up with customer expectations: Shoppers expect speed, transparency and consistency across every touchpoint, so falling short on any of these can quickly erode trust.
- Creating meaningful engagement: Engagement must extend beyond transactions, with content, community or experiences that keep customers connected to the brand in between purchases.
- Turning visitors into customers: High traffic alone does not guarantee sales; optimizing conversion paths is critical when abandonment rates remain stubbornly high across the industry.
- Scaling logistics and inventory: Growth often exposes weaknesses in supply chain and inventory planning, where delays, shortages or overstock directly cut into both revenue and reputation.
Build A High-Revenue eCommerce Business With Digital Silk
Sustainable eCommerce growth comes from balancing demand generation with the ability to deliver value at every stage of the customer journey.
The insights above show how much eCommerce companies make is closely connected to how well they manage pricing, personalization, logistics and retention together.
Digital Silk analyzes your category, benchmarks and growth potential to design strategies that maximize revenue opportunities and position your business for sustained performance.
As a professional eCommerce agency, our services include:
- eCommerce development
- Custom web design
- Branding services for eCommerce
- Digital marketing for eCommerce
- Social media marketing for eCommerce
Our experts oversee the entire process from start to finish to deliver measurable performance and clear communication at every step.
Contact our team, call us at (800) 206-9413 or fill in the Request a Quote form below to schedule a consultation.
"*" indicates required fields


