Dark Mode
Want to measure the eCommerce success of your brand? Here are the most crucial metrics and KPIs to track and grow your business online.


Published: December 26, 2023
By 2026, the global eCommerce market will amount to more than 8 trillion U.S. dollars.
You don’t want to miss out on that potential revenue, so it’s essential that you grow and track the progress of your eCommerce store.
Keep reading to find out about the fifteen metrics to track to achieve eCommerce success.
Have an eCommerce Project? We deliver custom eCommerce solutions.
Request a Quote
What Is An eCommerce Metric?
An eCommerce metric is a quantifiable measurement of a website’s performance.
These metrics can give you important insights into various aspects of your eCommerce operation, helping you make informed decisions on how to improve your engagement strategies, user experience and increase sales.
Consequently, you can tailor your website, from design to content based on your prospects’ behavior, specifically addressing their needs and wants.
For example, if your cart abandonment rate is high, there is probably a blocker that prevents a certain percentage of your customers from finishing a purchase.
This is indicative of an issue with the checkout process — perhaps it’s too long or complex.
By following this metric, you’ll be able to determine the specific issue with checkout and by addressing it you will help your prospects in becoming your customers, effectively improving your sales and achieving higher rates of eCommerce success.
eCommerce Metric vs. ECommerce KPI
KPIs stands for key performance indicators.
They serve as business milestones through which you can track your progress.
While a metric gives you an insight, a KPI is a goal you wish to achieve with said metric.
For example, if your website gets 100 visitors each month, then you have your traffic metric.
However, if you wanted to increase said metric to 200 visitors each month, then you have your eCommerce KPI.
Revenue Metrics To Track For eCommerce Success
Revenue metrics are specific measurements that help you assess the financial performance of your business.
They are crucial for understanding the effectiveness of your sales and marketing strategies, helping you make informed business decisions.
The key revenue metrics are:
- Total sales
- Average order value
- Customer lifetime value
Total Sales
Total sales are the most important metric of any eCommerce business as they serve as a fundamental gauge of overall financial performance.
This metric goes beyond the value it provides as a snapshot of a business’ health — it is a foundational element for many other key performance indicators.
Tracking your total sales lets you know if your business’ performance is lacking, allowing you to come up with marketing campaigns or other efforts that might help you boost your total sales.
Average Order Value
Average order value (AOV) is the average amount of money your customers spend each time they place an order.
To calculate AOV, you divide the total revenue by the number of orders over a given period. The formula is:

For instance, if an online store generates $50,000 in sales from 1,000 orders in a month, the AOV would be $50.
By measuring it over time, you can gain insights into the average spending habits of your consumers, and it will help you set realistic KPIs.
For example, if you’re trying to increase your total sales by $10,000 and your average order value is $100, you will need to acquire 100 new customers to meet your goal.
Customer Lifetime Value
Customer Lifetime Value (CLV) is the total revenue you will earn from a single customer for as long as that customer buys products from you.
This is an essential metric for eCommerce success as it lets you determine the long-term value that a customer will bring to your business.
It will help you allocate resources to engage customers that have a high CLV while allowing you to conduct a profitability assessment of your products and customers, tailoring your content and offerings accordingly.
To calculate the CLV, use the following formula:
CLV = Average Order Value X The Number Of Orders Each Year X The Average Length Of A Customer Relationship

Conversion Metrics To Track eCommerce Success
We define conversion funnel as the framework used in marketing and sales to illustrate different stages a potential customer goes through before making a purchase on your website.
Conversion metrics therefore evaluate how effective your sales and marketing efforts are in turning potential leads, visitors and website interactions into customers.
We can divide the conversion funnel into the following stages:
- Top of the funnel: your target audience isn’t looking to buy a product from at this stage.
- Middle of the funnel: your prospects have visited your website and are considering buying your product.
- Bottom of the funnel: the customers are ready to buy your product — they might just require an additional push.
By tracking conversion metrics, you will be able to identify areas of your conversion funnel that aren’t as effective in turning leads into customers, allowing you to address this issue.
The most important conversion metrics are:
- Conversion Rate
- Cart Abandonment Rate
- Customer Acquisition Cost
Conversion Rate
Conversion rate refers to the number of people who accessed your website and bought your product.
To calculate the conversion rate of your website, use the following formula:
Conversion Rate = (Number of Conversions / Number of Website Visitors) × 100
The number of conversions is the number of people that have purchased a product from your website. Multiplying that number by 100 gives you the percentage.
The average conversion rate for eCommerce websites is 2.5% to 3%.
If your conversion rate is lower than that, it means that one or more stages of your funnel aren’t as effective as you need them to be and you want to make necessary adjustments to make them convert potential leads as much as possible.

Cart Abandonment Rate
Cart abandonment rate refers to the number of people who put your product into the virtual cart but never completed the purchase.
Considering that the average cart abandonment rate is 70%, it is inevitable that you will see a certain number of your carts abandoned.
That said, a higher cart abandonment rate suggests that there is an issue with the checkout process, as your prospects came all the way to the end of your funnel without finishing the purchase.
Typically, this is indicative of one or more of the following issues:
- Complex checkout process
- Lack of payment options
- High shipping costs
- Lack of guest checkout option
You can also directly address this issue by sending email reminders to prospects who subscribed to your newsletter or completed email sign-up, urging them to revisit your store and complete their purchase.
To calculate the cart abandonment rate, use the formula below:
Cart Abandonment Rate = (Number of Carts Abandoned/ Number of Carts Created) × 100

Customer Acquisition Cost
Your customer acquisition cost (CAC) refers to the amount of money you need to spend to acquire a new customer.
You can calculate it by dividing your monthly marketing expenses by the number of new customers you acquired post-campaign. To calculate your CAC:
CAC = Number of New Customers Acquired / Total Cost of Sales and Marketing
By tracking your CAC, you will be able to compare it to your CLV.
Comparing your CAC to your CLV lets you know exactly how much you will earn from a single customer and how much it costs to acquire them — you will have an exact number of how much revenue you will generate per customer.
If your acquisition costs are too high, you might need to revisit your customer acquisition strategy and identify a way to acquire new customers for a lower cost.

Explore Bethpage’s case study and learn how we increased user acquisition by 4161% through custom website and branding.
Customer Engagement Metrics To Track eCommerce Success
Customer engagement metrics highlight the level of engagement between your business and potential customers.
From social media engagement to customer loyalty and retention, engagement metrics give you valuable insight into how effectively you engage your audience and convert and retain them.
The three most important customer engagement metrics are:
- Website traffic
- Bounce rate
- Time on site
We deliver custom eCommerce solutions.
Request a Quote
Website Traffic
Keeping track of your website traffic means knowing the number of your website visitors and how they landed on your webpage.
You can use Google Analytics to track this information.
There isn’t a one-size-fits-all number in terms of how many visitors you need to experience eCommerce success.
Rather, you want to attract visitors that are genuinely interested in buying your product.
After determining your ideal customer persona, you want to use the below strategies to engage and convert them:
- Optimize content for search engines
- Employ social media marketing
- Use paid advertising
- Generate and engage your email subscriber list
Learn our case studies and see how we increased the organic traffic of some of our clients:
- Keona Health: We grew organic traffic by 42% through strategic optimization
- Tec5 USA: We increased website traffic by 230% through SEO optimization
- Orthoeast: We increased organic traffic of the website by 138% with a new website
- LawSB: We secured 14x more organic traffic and secured top 10 search positions for key legal keywords
Bounce Rate
Bounce rate is the metric showing the number of people who landed on your website and left without interacting with your page.
A “single-page session” refers to instances where a visitor opens a single page on your website and then exits without triggering any other requests to the analytics server during that session.
For eCommerce websites, the usual bounce rate would be anywhere between 20% —40%.
You can calculate the bounce rate using the following formula:
Bounce Rate = (Number of Single Page Visits / Total Number of Visits) x 100
A higher bounce rate might indicate that the page isn’t relevant or engaging to visitors or it might suggest technical issues like slow loading times.
However, it’s important to interpret this metric in context, as some web pages (like blog articles or landing pages) may naturally have a higher bounce rate.

Time On Site
Time on site is a metric that measures the average amount of time a visitor spends on a website during a single session.
The time on site metric is calculated by summing the duration of time a user spends on a website across all pages visited and then dividing that total by the number of sessions.
The formula is:

Although there is standardized time on site that translates directly into revenue across industries, typically you want your users to spend around 1 minute on your page.
This suggests that your visitors found your content interesting or valuable.
Customer Satisfaction Metrics
Customer satisfaction metrics show the overall satisfaction of your audience with your product or service.
They are important to track when measuring not only eCommerce success but the success of brands across industries.
By tracking metrics such as the customer satisfaction score, net promoter score and retention rate, you gain valuable knowledge about your audience’s opinions and experience in the interaction with your brand.
Customer Satisfaction Score (CSAT)
Customer satisfaction score (CSAT) is the percentage of satisfied customers that have purchased your product.
You can determine your CSAT score through a survey.
By asking your customers a simple question: “How would you rate your experience today?” or “How would you rate this product?” and giving them a scale of 1 – 5, you can get the average CSAT score of your offering.
Assuming 1 represents a very dissatisfied customer and 5 represents a very satisfied customer, you want to count your positive scores (4 and 5) and divide the total with the number of survey respondents.
Then, to get the percentage, you will multiply that number by 100. The formula to calculate your CSAT score:
CSAT = (Number Of Satisfied Customers / Number of Respondents) X 100.

For an eCommerce business, you want to have a score anywhere between 75% and 85%.
Having a lower CSAT score means that your customers aren’t fully satisfied with your product or service.
To address that, you want to examine your product and implement one or more of the following strategies:
- Analyze customer feedback to learn about their concerns and issues
- Improve customer service
- Enhance one or more stages of your conversion funnel
- Offer incentive and loyalty programs
Net Promoter Score (NPS)
Net Promoter Score is a metric showing how likely a customer is to recommend your brand or service to a friend or family member.
Implementing the NPS is simple: you can ask your costumers to answer a short question after they finish the checkout process in your online store.
quote block: “On a scale of 1 to 10, how likely are you to recommend our product/service/company to a friend or colleague?”
Based on their answer, you can categorize your survey respondents into:
- Promoters: customers who are satisfied (9 – 10) and are likely to recommend you to a friend.
- Passives: customers who are somewhat satisfied (7 – 8) but aren’t enthusiastic about recommending your brand.
- Detractors: customers who aren’t satisfied (6 and below) and will not recommend you to a friend.
To calculate your NPS score, you want to determine the percentage of promoters and detractors.
- Promoters: Number of Promoters / Total Survey Respondents X 100
- Detractors: Number of Detractors / Total Survey Respondents X 100
Then you want to subtract the number of detractors from the number of promoters and you will have your NPS score.
An NPS score can range between –100 to 100.
Any score above 0 is considered “good” while any score above fifty would be considered “excellent”.
For eCommerce, the average NPS is 62.
The main way to increase a low NPS score would be to collect and analyze customer insights and then to address them accordingly.
Customer Retention Rate
The customer retention rate is a metric showing the percentage of customers you retain over a specific period.
Calculate your customer retention rate with the following formula:
Customer retention rate = Number of Customers at the End of the Period – New Customers You Acquired During the Same Period / Number of Customers at the Start of the Period x 100.
You want to look at a specific period when calculating your retention rate and to compare the total number of customers at the end of the period against the new customers you gained throughout the period.
While the typical retention rate for online retailers is around 28%, the number can vary based on your online store’s industry.
Having a low retention rate number can be indicative of several issues and the best way to address them is to gather and analyze customer insights.
Return and Refund Metrics
Return and refund metrics are important metrics to track in any eCommerce business as they help you evaluate customer dissatisfaction with your product or service.
The average return and refund rates vary from industry to industry; however, you want to make sure to decrease refund and return rates as much as possible, regardless of the industry in which you operate.
Online stores can feel the effect of return and refund: on average, 16.5% of online products get returned each year.
Return Rate
Return rate refers to the number of products that the customer purchased and later returned to the seller for a refund or exchange.
While you want to minimize the number of returned items, it is inevitable that some customers will return your product.
The average return rate for eCommerce business is around 20% to 30%.
Refund Rate
The refund rate refers specifically to the number of products your customers returned for a refund.
You want to track this metric as it shows you the overall dissatisfaction of your customers with your product, allowing you to identify areas for improvement.
You can calculate your refund rate percentage using the following formula:
Refund Rate = (Number of Refunds / Number of Sales) X 100

Return On Investment (ROI)
In terms of eCommerce, ROI is the financial metric displaying your profits from a specific investment relative to its cost.
Specifically, it shows you your profits from marketing or advertising activities.
A positive ROI shows your initiative generated money for your business, whereas a negative ROI suggests a loss.
You can use ROI to determine the efficacy of your marketing efforts.
Consequently, you can determine which campaigns or initiatives result in profit and which marketing efforts just aren’t worth it.
eCommerce Services At Digital Silk
At Digital Silk, we’re a full-service marketing agency.
We offer all of your eCommerce digital needs under one roof — from web design to development, branding, marketing and more.
We’ve helped numerous clients achieve measurable results for their eCommerce brands.
Regardless of your industry and specific business goals, we have the expertise to help you stand out in your crowded marketplace and engage your target audience.
We do so by designing and developing custom websites that work for your brand.
Our service include:
- Custom web design
- Custom web development
- eCommerce design and development
- Magento web design and development
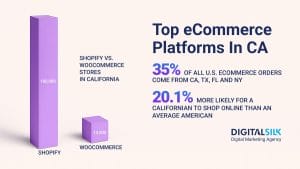
- Shopify web design and development
- WooCommerce web design
We operate with complete transparency and treat every project like our own to deliver measurable results for your eCommerce brand.
Contact our team or call us at (800) 206-9413 to tell us more about your eCommerce website project.
Request A Quote For Your eCommerce Project
Tell us about your goals and let our experts give you a custom proposal.
"*" indicates required fields
![Buy Now, Pay Later Market Trends & Statistics [With Charts] image](https://www.digitalsilk.com/wp-content/uploads/2026/04/bnpl-statistics-hero-image-300x169.png)