Social Media Metrics: Key Highlights
-
Engagement reveals real impact: Track how users interact to uncover what drives relevance, trust and loyalty.
-
VCR and CTR show content performance: Measure attention and action to optimize what resonates and converts.
-
SSoV benchmarks brand visibility: Compare your share of conversation to spot growth and outpace competitors.
How do you know your social media efforts are truly effective?
Without the right data, even the best-looking content can fall flat — and you might not even realize it.
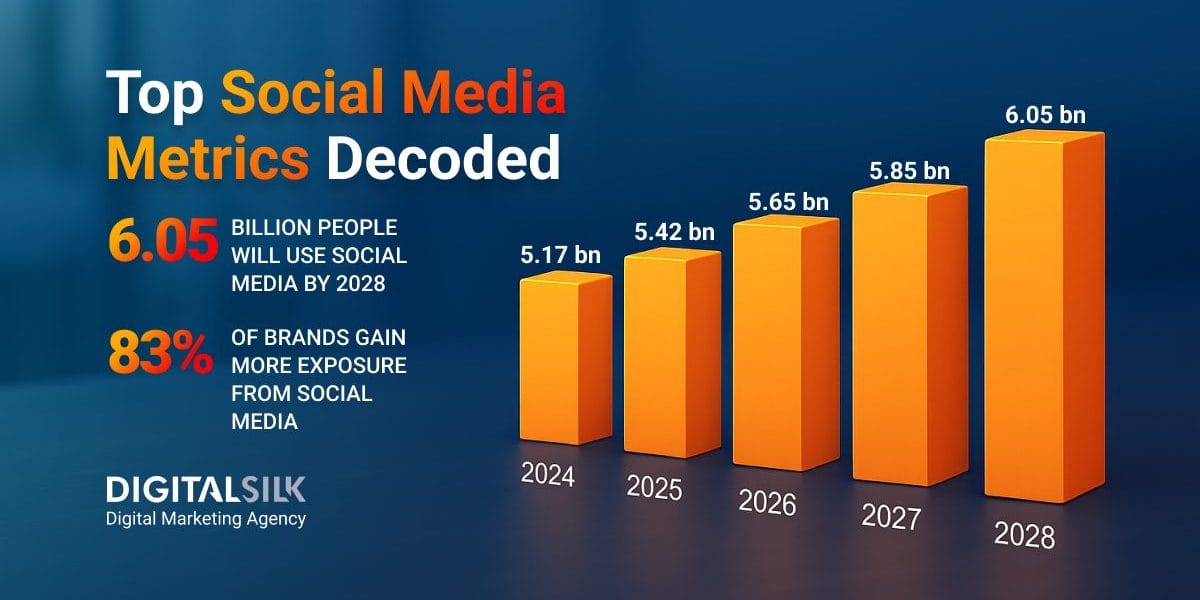
With 6.05 billion people expected to use social platforms by 2028, falling behind now means handing attention — and market share — to your competitors.
Below, you’ll find 10 important social media metrics to track beyond surface-level engagement to reveal what’s actually driving growth, loyalty and real business results.
1. Engagement Metrics
If you’re not paying attention to how people interact with your brand on social media, you’re missing more than just likes — you’re missing patterns, signals and business opportunities.
Engagement isn’t just about looking popular — it’s about understanding what earns attention and drives action in a space where attention is limited.
What Engagement Metrics Really Tell You
The average user now spends 143 minutes per day on social platforms.
That’s nearly two and a half hours of scrolls, taps and clicks — plenty of moments to win or lose attention.
Engagement metrics tell you how your brand fits into that window by reflecting what people do with your content:
- Likes/Reactions: A quick sign of interest
- Comments: A cue that something sparked thought or emotion
- Shares/Retweets: The clearest signal your content was worth passing on
- Saves: A high-intent action that shows lasting value
If your goal is to build relevance, trust and loyalty, these social media engagement metrics are your early indicators.
Why Engagement Rate Matters In 2025
Engagement rate isn’t about popularity — it’s about relevance.
A smaller audience that consistently interacts with your content can be more valuable than a large one that scrolls past.
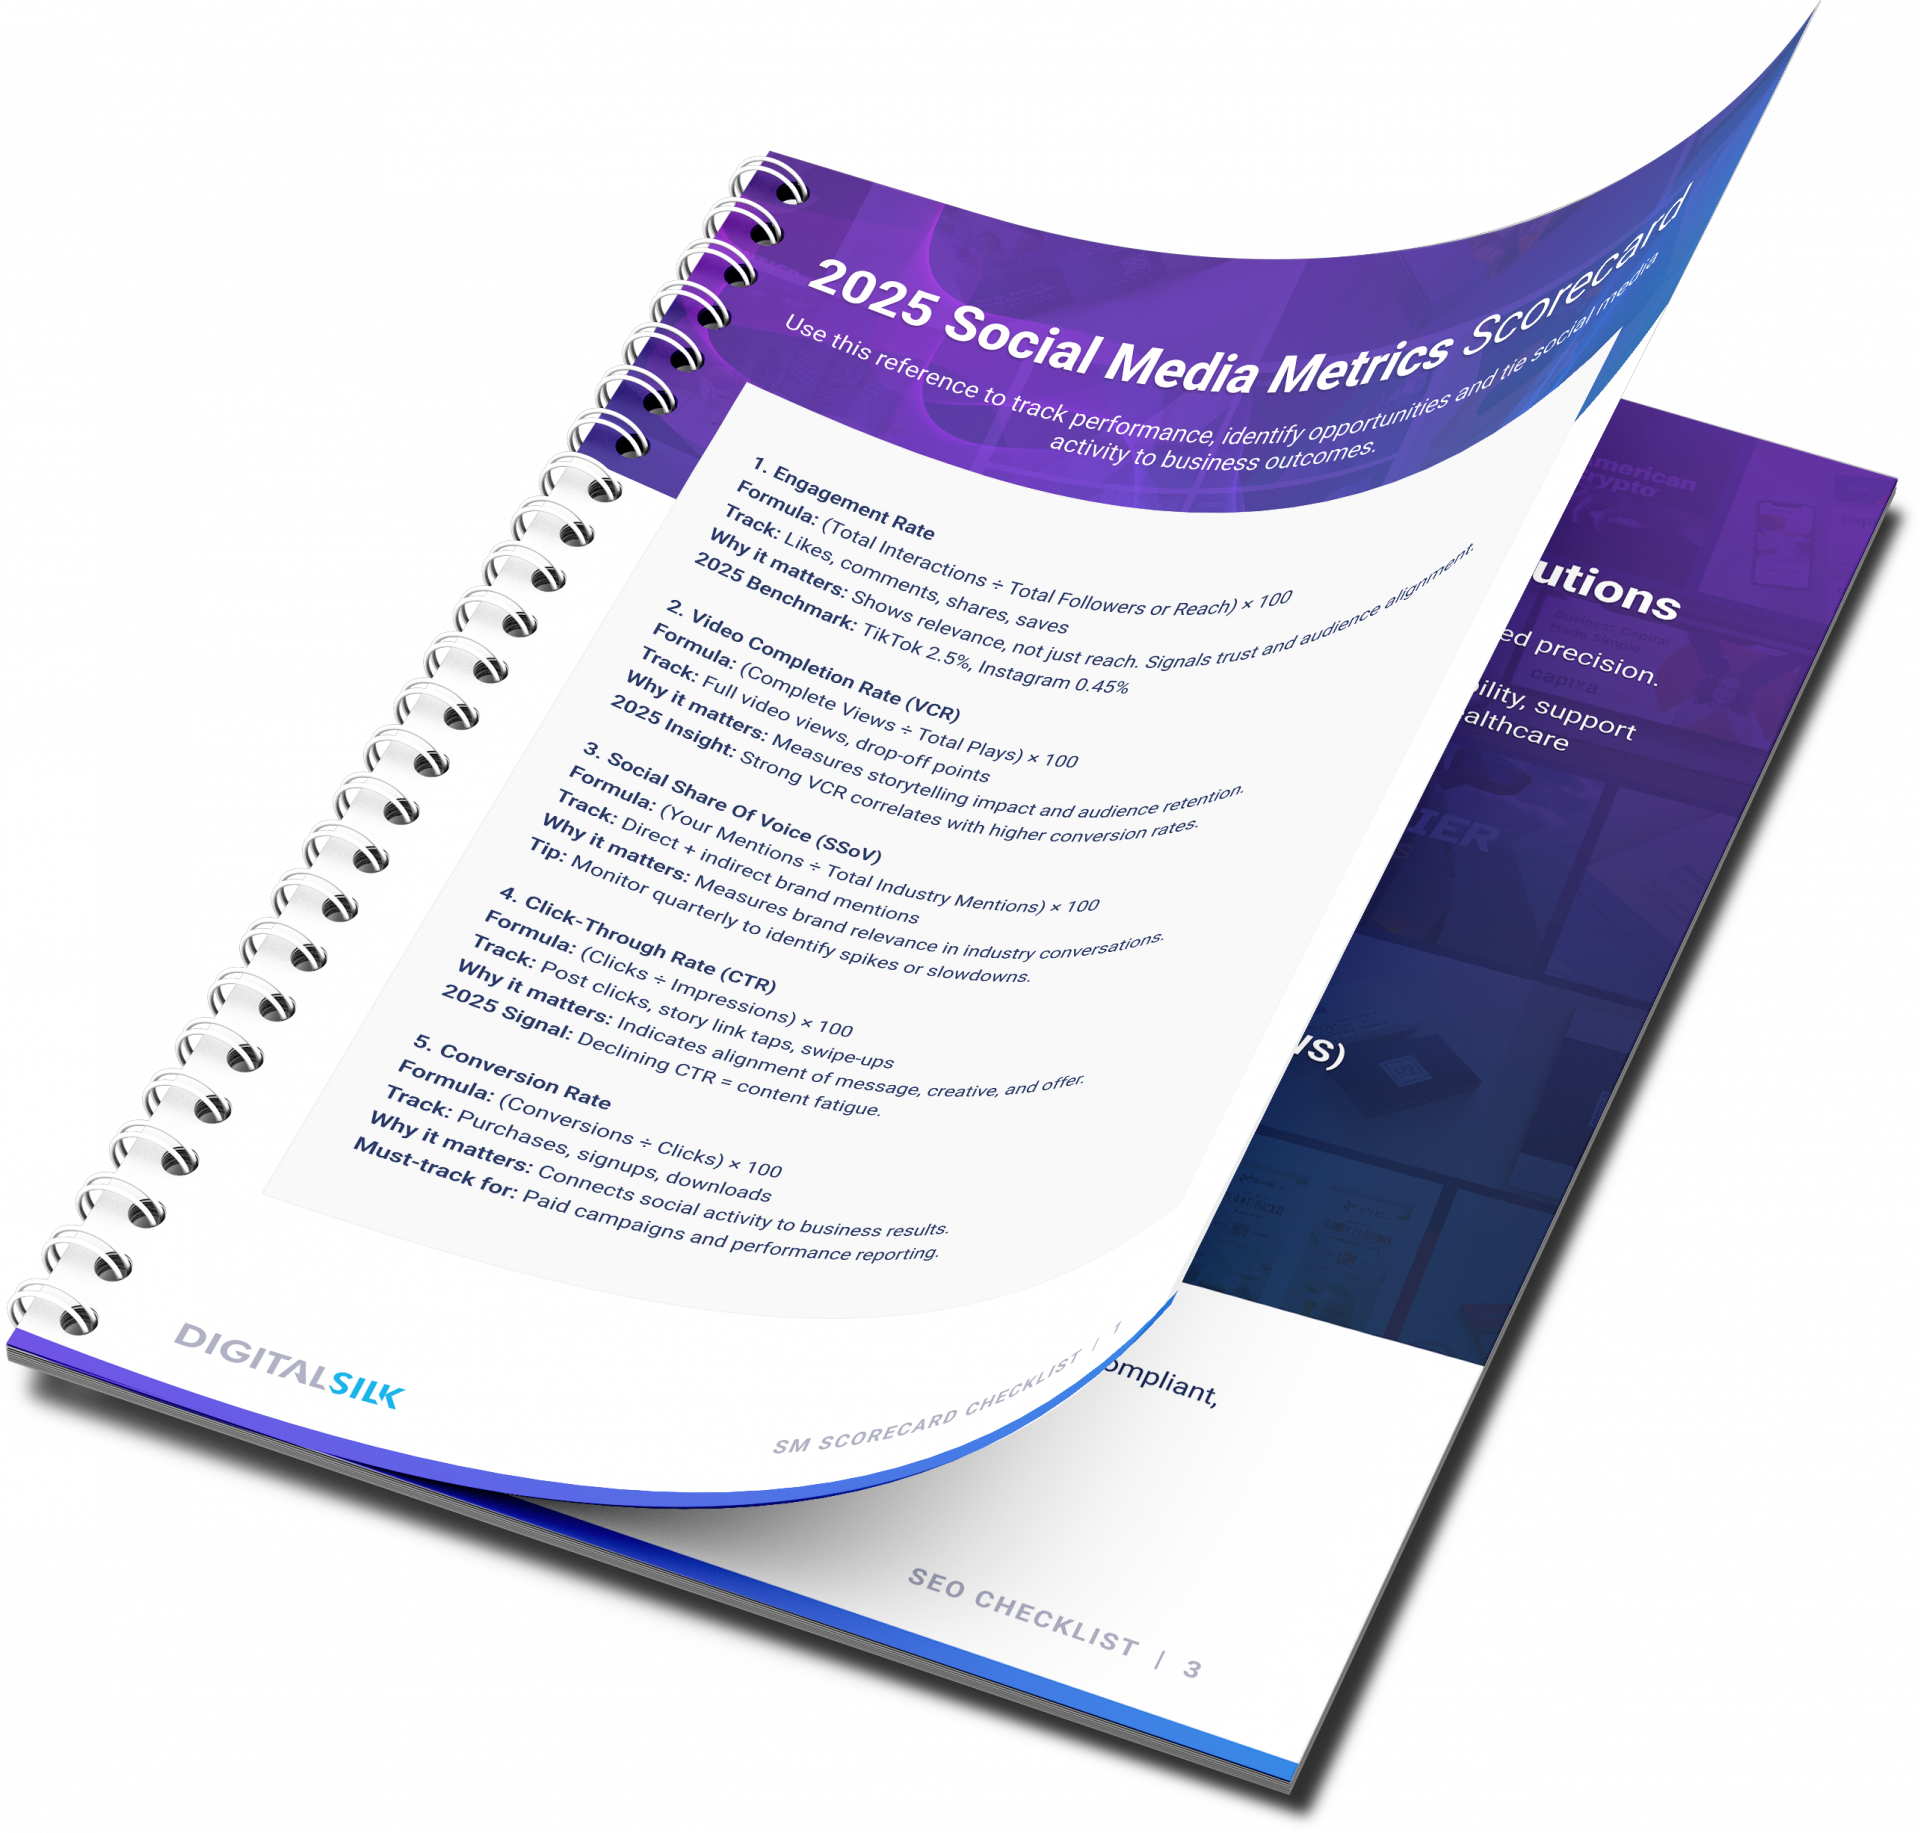
At the platform level, TikTok currently leads with a median engagement rate of 2.50%, while Instagram trails at 0.45% — a clear indicator that not all platforms offer equal potential for audience connection.
If you want to build trust, visibility and influence in real time, this is one number worth watching closely.
How To Track Social Media Engagement Metrics
Your engagement rate calculates the percentage of people who interact with your content compared to your reach or audience size.
The standard formula looks like this:
Engagement Rate = (Total Engagements / Total Followers) × 100
For example, if your post receives 100 interactions (likes, comments, shares) and you have 1,000 followers, your engagement rate is 10%.
Many social media professionals, however, prefer this more accurate formula:
Engagement Rate = (Number of Interactions / Actual Reach) × 100
The second approach is especially useful when assessing how content performed among people who actually saw it, rather than your total audience.
You can track engagement directly within each social platform — Instagram, LinkedIn, Facebook, TikTok and X all offer analytics dashboards that show performance data for individual posts and campaigns.
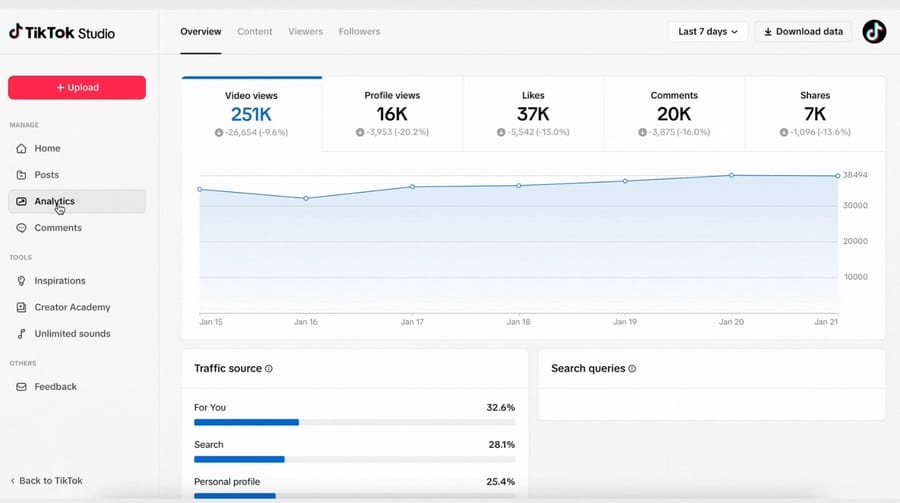
For a more organized view, you might also create a reporting framework or spreadsheet to compare trends across platforms or periods.
2. Video Completion Rate
A video view doesn’t tell you much on its own. What matters is whether people stick around long enough to hear what you’re actually saying.
Completion rate gives you a clearer answer — it shows whether your content holds attention all the way through or loses viewers halfway in.
What Video Completion Rate Really Tells You
Video completion rate (VCR) tells you the percentage of viewers who watched your video all the way through.
It’s sometimes referred to as view-through rate (VTR) and it’s one of the most direct ways to measure how engaging your content really is.
The formula for calculating VCR is straightforward:
VCR = (Number of complete views ÷ Total video plays) × 100
If you post a product demo and 75 out of 100 viewers finish the entire video, your VCR is 75%. That’s not just a number — it’s proof that your message landed.
High completion rates often reflect clear storytelling, solid pacing and strong alignment with audience expectations.
On the other hand, a sharp drop-off tells you where attention faded and where you need to adjust.
Why Video Completion Rate Matters In 2025
22% of social media marketers say their biggest challenge is creating content that keeps people engaged.
That’s not surprising — people scroll quickly, tune out even faster and rarely give content a second chance.
Completion rate tells you whether your content earns that attention — and what happens as a result.
Here’s why it matters:
- Signals content quality: A high completion rate shows that your content delivers value, holds attention and respects the viewer’s time. A low rate often points to issues with structure, clarity or tone.
- Impacts distribution: Platforms are more likely to surface videos with strong completion rates, as it indicates relevance and retention. If you’re aiming for broader reach without increasing ad spend, this is the metric to watch.
- Informs future content decisions: Drop-off data pinpoints exactly where viewers lose interest — so you can fix weak intros, cut filler and refine calls to action in future videos.
- Correlates with conversion: Viewers who finish your video are more likely to understand your message and take action. Whether it’s booking a demo or exploring a product, they’ve seen the full pitch.
VCR isn’t just a signal for algorithms — it’s a reality check for your messaging. If people aren’t watching, the content isn’t working.
Completion Rate Vs. View Count
Most platforms still show views as the headline metric. But views only measure starts, whereas completion rate measures impact.
A 30-second video might be counted as “viewed” on some platforms after just 3 seconds.
That means your view count could look strong even if 80% of viewers dropped off before the key message.
That’s why Instagram added a View Rate feature — to give marketers a better look at how many people are still watching after the first few seconds.
To dig deeper, pair completion rate with:
- Watch time — Are people spending real time with your content?
- Drop-off points — Where exactly do viewers lose interest?
- Retention curve — Do most people leave early
,or are they dropping off steadily?
3. Social Share of Voice (SSoV)
You might know how your brand is performing — but do you know how loudly it’s being talked about compared to your competitors?
Social Share of Voice (SSoV) measures exactly that — how much space your brand takes up in broader industry conversations.
For executive teams focused on growth, market position and brand relevance, this metric offers a direct read on visibility that goes beyond internal key performance indicators (KPIs).
What SSoV Really Tells You
SSoV measures the percentage of total industry mentions that your brand earns across social platforms.
It includes:
- Direct mentions: Posts that tag your brand by handle (e.g. @YourBrand)
- Indirect mentions: Posts that reference your brand name without a tag
Unlike metrics that only track your own numbers, SSoV puts your visibility into context.
It shows who’s leading the conversation, who’s gaining ground and who’s being left out of the dialogue.
You’ll also get a clearer view of which platforms matter most to your audience, where your competitors are getting traction and which voices — customers, influencers, media — are driving attention.
Why SSoV Matters In 2025
83% of marketers say social media has increased exposure for their business, but exposure alone doesn’t tell you where you stand in the market.
That’s what makes SSoV valuable — it turns raw attention into competitive intelligence and improves brand health.
Here’s how your team can use it:
- As a positioning tool: If your share of voice is growing faster than your market share, it’s often an early indicator of sales momentum. If it’s shrinking, that could signal eroding visibility — before it shows up in revenue reports.
- To spot rising competitors: A sudden spike in mentions for a competitor may point to a new product, campaign or PR win. SSoV helps you react faster and beat the competition to the punch.
- To evaluate campaign impact: By comparing SSoV before and after a product launch or rebrand, you’ll get a clear read on how much your team shifted the conversation.
- To guide content and channel strategy: If competitors are gaining voice on platforms where you’re quiet, or if your indirect mentions are growing faster than direct ones, that’s a sign your reach may be growing organically — and worth amplifying.
Tracking this consistently can also reveal whether you’re building real traction or simply getting short-lived spikes in attention.
When done right, SSoV becomes more than a metric — it becomes a benchmark for how visible and relevant your brand is within the conversations that shape your niche.
How To Track SSoV
Calculating SSoV requires consistent monitoring of brand mentions across social platforms.
The formula is straightforward:
SSoV = (Your brand’s mentions ÷ Total industry mentions) × 100
To calculate it:
- Count all mentions of your brand across major social platforms
- Do the same for key competitors — focus on those with similar audience profiles or market share
- Add all mentions together to get the total industry volume
- Divide your brand’s mentions by the total, then multiply by 100 to get your percentage
Most brands use social listening tools or third-party dashboards to monitor this consistently, especially at scale.
But even a manual check — done quarterly — can surface trends worth exploring.
What matters most is how this percentage moves over time.
Track SSoV alongside metrics like engagement rate, branded search and site traffic and it becomes a reliable signal for brand awareness and market positioning.
4. Click-Through Rate (CTR)
Every brand wants visibility — but what really matters is what happens after someone sees your content.
Are they interested enough to click?
What CTR Metrics Really Tell You
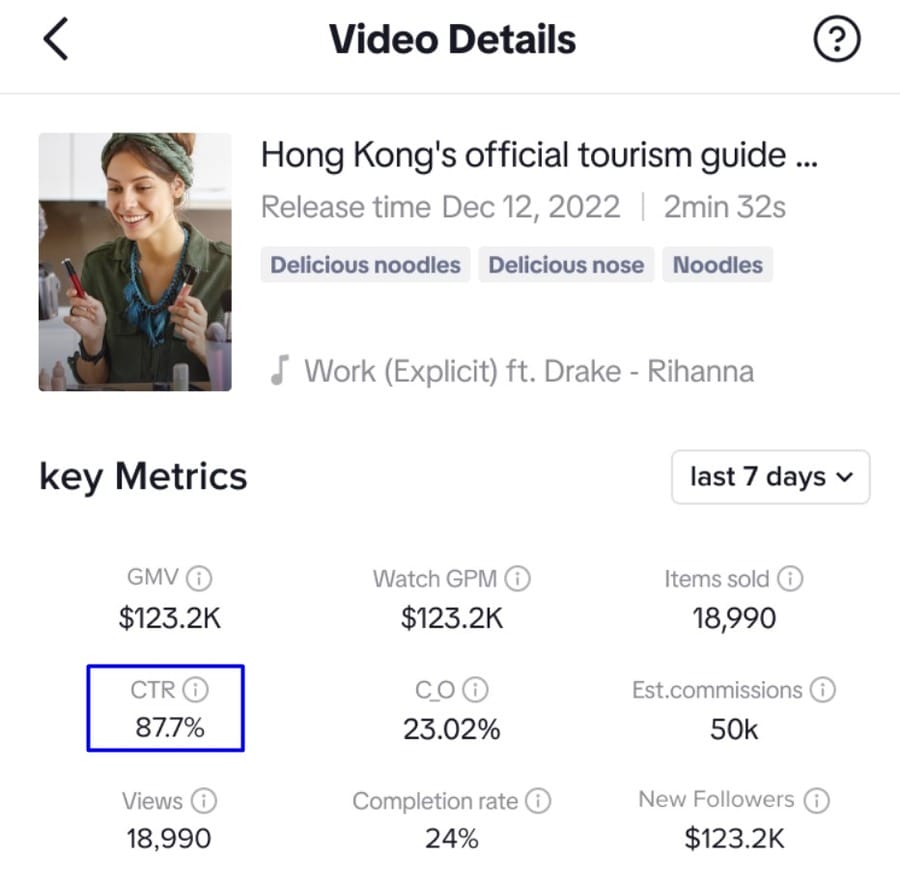
CTR measures the percentage of people who clicked on a link in your social content after seeing it.
It’s calculated like this:
CTR = (Number of Clicks ÷ Number of Impressions) × 100
For example, if a post gets 100 clicks from 2,000 impressions, the CTR is 5%.
While that formula is simple, the insights are not. CTR shows how well your messaging, creative and targeting come together to prompt action.
Unlike views or likes, which often reflect passive interest, CTR captures deliberate intent.
It tells you who’s curious enough to go deeper — whether that’s to explore a product, read more or register for something that matters.
Some platforms are beginning to spotlight CTR more prominently.
TikTok, for instance, now includes average CTR in its creator analytics, reflecting growing recognition that this is one of the most meaningful measures of content performance.
Why CTR Matters In 2025
Posting regularly is expected — but that alone doesn’t create momentum.
In 2025, brands are averaging 4.5 posts per week on Instagram and 4.2 on Facebook, yet most of that content goes unnoticed.
CTR shows whether your posts are getting people to act.
Here’s why it’s worth tracking:
- Connects content to outcomes: A rising CTR means people aren’t just seeing your content — they’re responding to it. It’s one of the clearest indicators that your creativity and targeting are aligned.
- Flags performance issues early: A declining CTR is often one of the first signs of audience fatigue or messaging drift. It can alert your team before bigger problems show up in traffic or conversions.
- Validates your messaging in real time: If people aren’t clicking, the offer might not be clear or compelling. CTR gives you rapid feedback on whether your value proposition is landing the way you intended.
- It’s easy to focus on content volume, but what you really need to know is: how often does that content convert attention into action?
How To Boost Your CTR Through Strategic Content
Boosting CTR isn’t about pushing harder — it’s about aligning better.
Here are five ways to do that without overcomplicating your strategy:
- Lead with clear, specific value: Make the benefit obvious from the first line — don’t bury it.
- Use strong, direct calls to action: Invite people to do something meaningful, not just “learn more.”
- Tailor visuals for each platform: Content that fits the format naturally gets more attention.
- Surface offers and value props early: If there’s a deal, lead with it — don’t tuck it into fine print.
- Incorporate proof points: If you’ve got testimonials, results or reviews, pair them near clickable links to build trust quickly.
Finally, remember that not all clicks are equal. A modest CTR from a well-targeted audience will outperform a high CTR from the wrong one.
Digital Silk’s expert team implemented targeted ad campaigns and lead generation strategies for AGS Devices, resulting in a 50–85% higher click-through rate than the industry norm.
This marketing approach also drove a 90.56% increase in user engagement through optimized conversion funnels and strategic analytics.
5. Conversion Rate
If click-through rate shows who’s interested, conversion rate shows who followed through.
It’s the difference between attention and action — the point where curiosity turns into something measurable, like a lead, a sale or a signup.
Tracking CTR is useful, but without conversions, clicks don’t pay off.
What Conversion Rates Really Tell You
Conversion rate measures the percentage of users who complete a defined action after interacting with your social content.
Conversions are more meaningful than likes, shares or even clicks, as they tie your content directly to outcomes that matter to your business.
These social media success metrics might include:
- Purchasing directly from a social post
- Subscribing to your email newsletter
- Downloading resources like guides or whitepapers
- Registering for events or webinars
- Completing contact forms
The flexibility of this metric is part of its value — you define what counts as a conversion based on your goals.
It’s also one of the best ways to identify what’s working. If two posts generate the same number of clicks, but one produces three times the conversions, the next step is clear.
Why Conversion Rates Matter In 2025
Only 8% of marketers aren’t concerned about the ROI of their social media strategies, which means nearly everyone else is under pressure to prove impact.
CTR tells you what sparks interest, but conversion rate shows whether that interest leads anywhere.
Here’s why that matters:
- Connects content to business outcomes: Conversions provide a direct link between social activity and metrics your leadership team cares about — pipeline, revenue, registrations and qualified leads.
- Keeps paid campaigns accountable: For paid efforts, conversion rate helps you understand whether clicks are worth what you’re paying for them. Without that data, you’re flying blind on return.
- Supports smarter content decisions: When you track conversions over time, patterns emerge — about which formats, messages or offers are most persuasive at different points in the buyer journey.
For example, Digital Silk executed a holistic marketing strategy for Barton G, integrating email, social media and PPC campaigns to create a luxury digital experience.
This approach, combined with the retrieval of locked Meta profiles and animated social content, significantly boosted online visibility and drove conversions through optimized, visually rich marketing channels.
How To Track Conversion Rates
This is the formula for calculating your social media conversion rate:
Conversion Rate = (Number of Conversions ÷ Number of Clicks) × 100
To monitor this consistently:
- Use platform-specific tracking features like Facebook Pixel or TikTok Events
- Set up UTM parameters and track actions in tools like Google Analytics
- Align with your CRM to attribute leads or purchases back to specific posts or campaigns
6. Customer Satisfaction Score (CSAT)
Every brand wants loyalty, but that starts with knowing how your customers really feel.
Social media metrics like reach and engagement tell part of the story, but CSAT gives you something more direct — feedback from your target audience.
What CSAT Really Tells You
CSAT measures how satisfied your customers are after interacting with your brand — whether that’s through a support exchange, product experience or social channel.
It varies by platform, with TikTok currently leading with a CSAT score of 78 in the U.S., reflecting how younger audiences value fast, informal and responsive interactions.
This matters because expectations are high — and unforgiving. When customers feel ignored or frustrated, they don’t stick around.
CSAT gives you early signals that help you prevent churn before it starts.
Why CSAT Matters In 2025
77% of users are more likely to buy from brands they follow on social media, but that trust is fragile.
A slow reply, an impersonal response or a missed complaint can undo months of brand-building.
CSAT helps you stay ahead of those moments by tracking satisfaction in real time.
Here’s why it belongs in your metrics stack:
- It alerts you to dissatisfaction before it becomes visible elsewhere
- It gives your support and social teams a benchmark to improve against
- It connects frontline performance to broader goals like loyalty and revenue
Since CSAT is built on direct customer feedback, it gives you insights no internal report can surface.
How To Collect And Analyze CSAT
You can gather CSAT data through brief surveys sent shortly after an interaction concludes.
To get actionable data:
- Send short, 1–2 question surveys after support interactions
- Keep the language simple and relevant to the specific experience
- Reach out quickly — within hours, not days
- Segment responses by platform, team or issue type for better insights
Once you do, you can use the following formula to calculate the score:
CSAT Score = (Number of positive responses ÷ Total responses) × 100
7. Impressions vs. Reach
These two social media terms often get used interchangeably — but they tell very different stories.
Knowing the difference between impressions and reach helps your team understand not just how far your content spreads, but how often it’s being seen — and by whom.
What These Metrics Really Tell You
- Impressions count how many times your content appears on someone’s screen — including multiple views from the same person
- Reach reflects the number of unique individuals who saw your content, regardless of how many times
Think of reach as your guest list and impressions as how often guests looked at the invitation.
A high impression-to-reach ratio often signals “repeat interest” — content people come back to more than once.
Keep in mind: definitions vary by platform. TikTok counts “total video views” as impressions, while YouTube and X (formerly Twitter) report impressions without revealing reach at all.
Why These Metrics Matter In 2025
Both reach and impressions can shape your content strategy — but only if you know when and how to use them.
Here’s what to consider when analyzing these metrics for social media marketing:
- Use reach to assess audience growth: Are new people seeing your content or are you talking to the same group repeatedly?
- Use impressions to measure repetition: Are followers seeing your message enough times to remember it — or are you fading out of view?
- Use both to track visibility trends over time: A shrinking reach with flat impressions often signals a narrowing audience or algorithm fatigue.
The most effective brands aren’t just posting often — they’re using reach and impression data to fine-tune who they’re talking to and how often.
| Use Case | Track Reach When | Track Impressions When |
| Launching New Products Or Services | You want to measure how many new people see your message | You want to understand how often the same audience sees your launch |
| Entering New Markets | You need visibility into who you’re reaching in unfamiliar segments | You’re reinforcing brand awareness with repeated exposure |
| Testing New Audience Segments | You want to confirm that content is reaching different groups | You want to see if existing followers are engaging more frequently |
| Reinforcing Key Brand Messaging | You’re expanding the message to new potential customers | You’re staying top-of-mind with people already familiar with the brand |
| Evaluating Content Longevity | You’re assessing initial reach over time | You’re tracking repeated views as a signal of relevance |
8. Sentiment Analysis
Most metrics tell you what happened — sentiment analysis tells you why.
By analyzing the emotional tone behind social conversations, you can spot shifts in brand perception early on and understand what’s driving them.
What Sentiment Analysis Really Tells You
Sentiment analysis categorizes social mentions as positive, neutral, or negative, helping you move beyond raw counts to better understand public perception.
It draws from sources like:
- Customer reviews and ratings
- Social media comments and posts
- Support tickets and service interactions
- Survey responses and feedback forms
By assigning numerical scores to emotional responses, sentiment analysis transforms subjective feelings into quantifiable data you can track and measure over time.
Why Brand Sentiment Matters In 2025
Understanding how people feel about your brand isn’t just a marketing advantage — it’s a business signal.
84% of customers say being treated like a person, not a number, influences their purchasing decisions, which means tone, empathy and consistency across social channels directly shape buying behavior.
Here’s why sentiment analysis is worth watching:
- Helps surface early signs of discontent before they affect loyalty
- Explains why certain messages resonate while others fall flat
- Gives emotional context to conversion and engagement data
When tracked consistently, this social media metric helps you close the gap between performance metrics and real customer perception.
How To Track Social Media Sentiment
Tracking sentiment means understanding not just what people say about your brand, but how they feel when they say it.
Manual monitoring rarely scales, so most teams rely on sentiment tools to detect tone and flag changes in perception.
Tracking audience sentiment for your social media marketing includes:
- Collecting mentions across major platforms
- Analyzing tone and context using trained language models
- Reporting shifts in sentiment so you can respond quickly
9. Profile Visits
While many metrics focus on interaction, profile visits show intent.
When someone leaves a post to check out your full profile, it signals curiosity — and a possible next step in the customer journey.
What Profile Visits Really Tell You
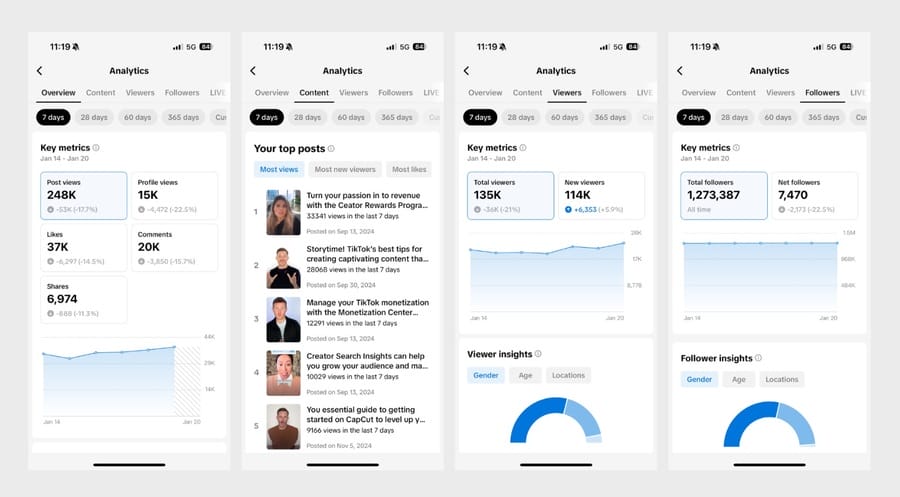
Profile views reveal which content gets people to dig deeper.
Whether it’s a campaign, a product post or a comment from an influencer, this metric tells you what’s working well enough to spark action.
TikTok, for example, breaks down profile visits by day and timeframe, making it easier to identify spikes and tie them to specific content.
These visits often correlate with surges in awareness, especially after viral moments or cross-platform amplification.
Why Profile Visits Matter In 2025
90% of consumers use social media to keep up with trends and cultural moments and profile visits are a clear sign of whether your brand is part of that conversation.
When people are curious enough to visit your profile, they’re asking a simple question: does this brand feel relevant to me right now?
That kind of interest doesn’t always show up in likes or comments — but it often signals the beginning of a relationship that can lead to long-term engagement or sales.
How To Use Profile Views to Measure Brand Interest
Profile visits are often a leading indicator of follower growth or conversion — but only if the experience matches the intent.
You can capitalize on these social media success metrics by answering these questions:
- Does your bio clearly explain what you do or offer?
- Are your pinned posts showcasing your strongest content?
- Is your call to action obvious and aligned with the visitor’s intent?
When your profile answers those questions well, casual interest turns into something more measurable — follows, clicks and conversions. When it doesn’t, interest fades fast.
10. Follower Growth Rate
Rounding off the list of important metrics for social media, follower growth rate tracks how your audience expands over time.
What Follower Growth Rate Really Tells You
Follower growth rate measures the speed at which your audience expands over a specific period.
You can calculate it using this formula:
Growth Rate (%) = [(New Followers – Original Followers) / Original Followers] × 100
When used consistently, it highlights trends tied to specific campaigns, platform changes or content shifts — especially when compared week over week or month over month.
Why Follower Growth Rate Matters In 2025
Growth rate reflects momentum — something raw follower counts often disguise.
It tells you whether your content is consistently attracting new interest or if your audience has plateaued.
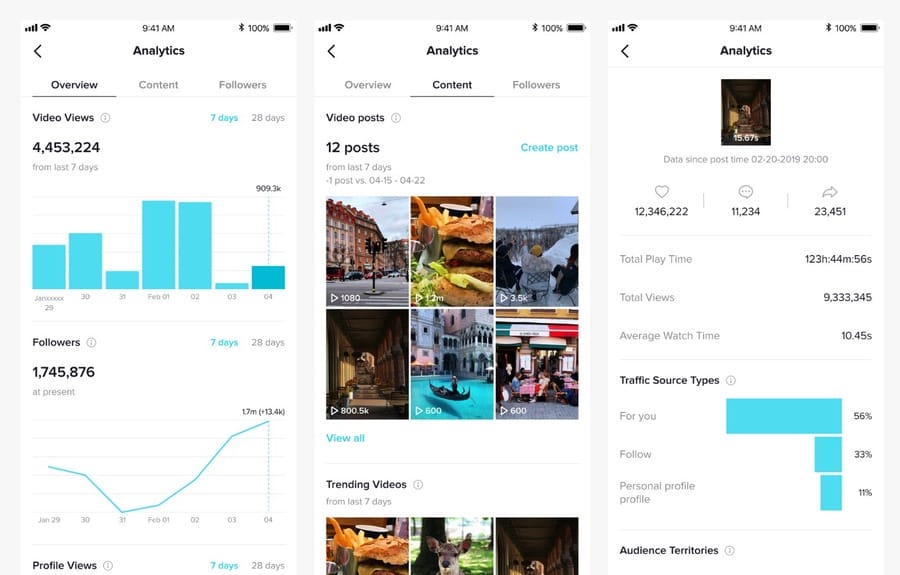
TikTok supports this approach with follower insights tied to individual videos, so you can see which content directly drives growth.
That kind of granularity turns follower data into a useful indicator of content performance and long-term relevance.
How To Maximize Follower Growth
Growth follows relevance. Focus on content that aligns with what your audience actually cares about, not just what fills your calendar.
Feature high-performing posts, refresh pinned content and make sure your brand story is immediately clear to first-time visitors.
Test different formats but track what brings people back — and what makes them stick around.
Create A Social Media Marketing Strategy With Digital Silk
Tracking social media metrics lets you gain direct insights into how your audience connects with your content.
When used effectively, they transform raw numbers into actionable insights that drive meaningful business growth.
Digital Silk uses data driven insights and strategies to maximize social media engagement metrics and brand visibility across all industries.
As a recognized web design agency, our services include:
- Social media marketing
- Digital marketing
- SEO services
- PPC advertising
Have a social media marketing project in mind?
Contact our team, call us at (800) 206-9413 or fill in the Request a Quote form below to schedule a consultation.
"*" indicates required fields


