Digital Marketing KPIs: Key Highlights
-
Clarity drives growth: The right KPIs reveal what moves the business forward, not just what looks good in reports.
-
Metrics shape action: Focused teams use data to guide faster, smarter decisions that fuel long-term results.
-
Insight fuels momentum: Predictive analytics turn static numbers into proactive strategies for growth.
What if the way you measure your marketing is quietly holding your growth back?
With global advertising and marketing spend expected to reach $1.87 trillion in 2025, knowing which numbers to trust is more important than ever.
The most effective teams rely on key performance indicators (KPIs), which are specific, measurable values that show whether their strategy is creating meaningful impact.
In this post, we’ll break down the top digital marketing KPIs that will still matter in 2026 because they give leaders the clarity to make better, faster decisions.
17 Best KPIs For Digital Marketing You Should Track In 2026
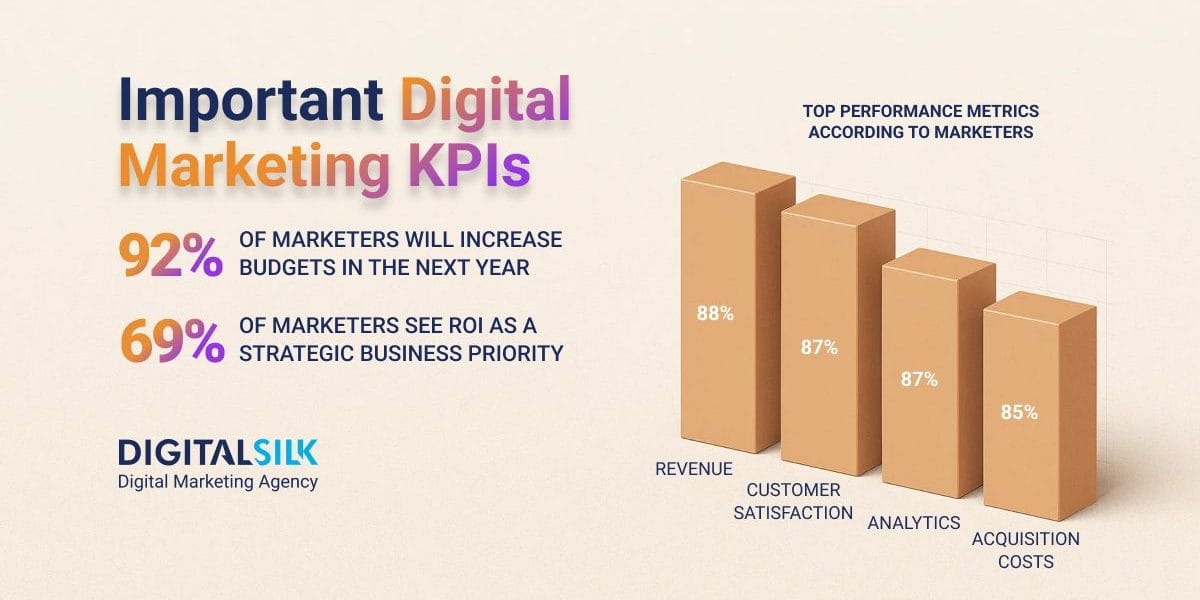
When 69% of marketers call proving Return on Investment (ROI) a top strategic priority, it’s clear that teams are under pressure to connect marketing performance with business results.
Tracking the right KPIs in digital marketing helps cut through vanity metrics and surface the insights that drive smarter budgets, stronger pipelines and clearer growth targets.
1. Customer Acquisition Cost (CAC)
Customer acquisition cost (CAC) shows what it takes to turn marketing and sales efforts into new revenue.
It reflects the total cost of attracting and closing new business, divided by the number of customers gained over a specific period.
With 15% of marketers naming traffic and lead generation as their biggest challenge, CAC helps focus spending where it has the greatest impact.
Tracking CAC across regions, channels and segments reveals where acquisition is working efficiently and where it drains resources without enough return.
Set clear targets by market to drive smarter decisions on where to invest and where to improve.
Keeping CAC within healthy ranges protects margins and creates more room to scale what works.
2. Return On Ad Spend (ROAS)
Return on ad spend (ROAS) answers a simple question: how much revenue your ads generate for every dollar spent.
To calculate it, divide the revenue from an ad campaign by the cost of running that campaign and you will see how efficiently your advertising converts spend into results.
Channel performance often varies widely, with YouTube leading social platforms at 48% ROAS, proving the value of matching the right message with the right audience at the right time.
Focus your teams on improving ROAS by:
- Aligning creative and messaging with each stage of the customer journey
- Simplifying conversion paths to remove friction after the click
- Building remarketing strategies that turn interest into revenue
- Running controlled tests on new channels before scaling spend
Break down ROAS by channel, region and audience segment to uncover where your budget drives the most impact and where it needs adjustment.
3. Customer Lifetime Value (CLV)
Customer lifetime value estimates the total revenue a single customer brings to your business over the course of their relationship.
It shifts the focus from one-time transactions to long-term revenue growth and helps prioritize where to spend for the highest return.
With 88% of marketers listing revenue as their top performance metric, tracking lifetime value keeps marketing and sales goals closely tied to what drives financial results.
Use this metric to pinpoint the customer segments worth the most over time and focus your acquisition and retention strategies accordingly.
Higher-value segments give you the flexibility to invest more in nurturing relationships without cutting into margins.
Analyze lifetime value by product, channel and market to keep growth plans focused on the segments that sustain your revenue goals.
When reviewing digital marketing KPIs examples, CLV consistently ranks as a key metric for driving long-term profitability.
You can increase customer lifetime value by:
- Strengthening retention programs to build longer relationships
- Expanding product adoption through upsell and cross-sell strategies
- Creating loyalty initiatives that reward repeat engagement
- Personalizing offers and communications based on purchase behavior
- Improving onboarding and support to help customers find value faster
4. Conversion Rates
Conversion rate measures how effectively your audience takes the action you care about, whether that is filling out a form, signing up for a demo or completing a purchase.
It reflects the percentage of people who move from interest to action, giving you a clear indicator of how well your marketing and customer experience turn traffic into outcomes.
Across industries, professional services lead with an average conversion rate of 4.6%, showing the value of trust, relevance and clarity in motivating buyers to take the next step.
Look for patterns in user behavior to optimize pages, forms and flows that sit between attention and revenue.
Small shifts in copy, design or timing often unlock improvements that raw traffic growth alone cannot deliver.
You can strengthen conversion rates by:
- Simplifying the customer journey to remove unnecessary steps
- Testing headlines, calls to action and offers for stronger engagement
- Using behavioral insights to personalize experiences at key touchpoints
- Reviewing performance regularly to spot and fix drop-off points across the funnel
5. Cost Per Lead (CPL)
Cost per lead measures how efficiently your marketing spend turns into potential customers.
It reflects what you pay to fill the top of your funnel and gives an early signal of whether acquisition efforts are fueling profitable growth.
With 92% of B2C marketers planning to increase their overall marketing investment in the next 12 months, this metric keeps spending tied to outcomes, not just activity.
You can improve performance by:
- Defining sharper audience segments to avoid wasting spend on low-intent prospects
- Refining targeting parameters in ad platforms to reach buyers who are ready to engage
- Testing creative and messaging that speak directly to your customers
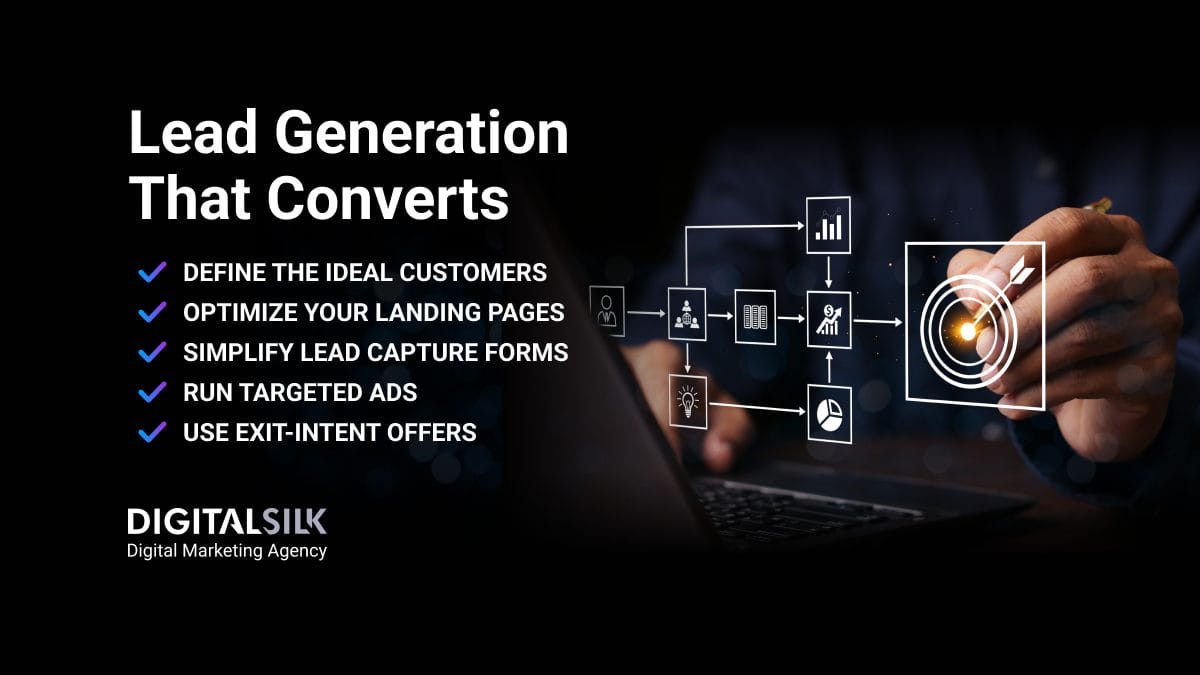
- Simplifying lead forms and landing pages to remove unnecessary friction
- Qualifying leads earlier in the funnel to focus on those most likely to convert
- Comparing lead cost with lead quality and sales performance to prioritize what drives revenue
- Reallocating spend toward the channels and tactics that consistently deliver value
6. Organic Search Traffic
Like many essential digital marketing metrics and KPIs, organic search traffic reflects a long-term growth opportunity beyond paid media.
This metric tracks how often your brand gets found without paying for the click and how well your content answers what buyers are already searching for.
Your SEO strategy matters more than you realize, especially since 49% of the top-ranking pages earns the largest share of search traffic for that keyword, driving both visibility and revenue without added media spend.
Search is where intent meets opportunity. People who search for your products or services are actively looking to solve a problem, which makes organic traffic one of the most valuable growth channels.
Monitoring organic performance by region and product line helps you decide where to expand your content strategy and where to build authority in markets where paid media alone will not scale profitably.
Strengthen your search performance by:
- Identifying the target keywords and optimizing your content around them
- Structuring your site and metadata to help search engines clearly understand each page
- Improving page speed and mobile performance to create a better user experience and stronger rankings
- Refreshing content regularly to stay relevant as customer needs and market trends evolve
7. Click-Through Rate
Click-through rate tracks how often people respond when your message meets their moment of interest.
It measures the percentage of views that turn into clicks, showing whether your ads, search listings or emails earn real attention.
In 2025, the average for search advertising sits at 6.66%, while arts and entertainment brands lead with 13.10%, a reminder that relevance and timing drive stronger engagement than volume alone.
Pay attention to where people actually respond and where they scroll past.
A 3.74% increase over the past year shows that steady improvements in targeting and creative lead to measurable gains.
8. Bounce Rate
Bounce rate tracks the percentage of visitors who leave your site after viewing a single page without taking further action.
It’s related to how well your pages meet visitor expectations in those first few critical moments.
Since 88% of marketers rely on analytics and measurement tools, this metric remains one of the clearest indicators of whether your content and experience hold attention or lose it too soon.
High bounce rates often reveal a mismatch between what visitors expected and what they found.
Sometimes the problem is a slow-loading page or confusing navigation. Other times, it’s the content itself failing to deliver value fast enough.
The key is to look at individual pages in context, since what works for a landing page may be very different from what works for a resource hub or product detail page.
Reduce bounce by:
- Fixing technical issues and simplifying the user experience to remove early friction
- Clarifying headlines and calls to action so visitors know what to do next
- Improving page speed to keep impatient visitors from leaving before the page loads
- Matching the content on the page to the intent behind the search or ad that brought visitors there
9. Brand Sentiment
Brand sentiment reflects how people feel when they talk about your company, whether in reviews, social media conversations or personal recommendations.
It measures emotional connection, giving you insight into whether your brand earns trust, loyalty and advocacy.
76% of consumers say they prefer to buy from brands they feel connected to instead of a competitor, which shows how sentiment influences purchasing decisions.
This metric helps you understand where your brand fits in your customers’ lives, beyond product features and price points.
Shifts in tone, whether positive or negative, reveal whether your marketing, customer experience or broader reputation are resonating the way you intended.
In competitive markets, where products and services often look similar, these emotional connections often shape long-term loyalty.
10. MQL Vs. SQL Ratio
Turning initial interest into real sales opportunities is where many growth strategies stall.
Marketing Qualified Leads (MQLs) signal early engagement, like downloading a report or attending a webinar, while Sales Qualified Leads (SQLs) are ready for a conversation with your sales team.
The shift between the two stages shows how well your qualification process filters interest into actionable pipeline.
Despite strong lead generation efforts, 80% of new leads never translate into sales, making this handoff one of the most important stages to watch.
A low conversion rate often points to weak scoring models, ineffective nurturing or unclear alignment between teams.
A strong conversion rate shows your efforts are finding the right buyers and bringing them to sales when it matters most.
To measure it, divide the number of SQLs by the number of MQLs and multiply by 100. Tracking this consistently helps marketing focus on the right prospects and gives sales teams a pipeline built for revenue, not volume.
12. Engagement Metrics Across Channels
These common digital marketing KPIs reflect where your audience is paying attention and how they are responding to your content.
Actions like likes, comments, shares and media coverage show whether your brand creates something people care enough to interact with.
Social media leads as a key channel, with 53% of marketers naming social engagement as their top content metric, while website engagement follows closely with the same percentage.
Measuring engagement across platforms helps you see which channels drive meaningful interaction and which ones fall short.
High impressions without response may suggest your content is being seen but not valued, while steady engagement signals that your brand is part of the conversations that matter to your audience.
13. Social Share Of Voice (SSoV)
Social share of voice (SSoV) measures how much of the conversation in your market belongs to your brand compared to competitors.
It reflects the share of mentions across social media and earned media, showing where your brand stands when customers, media and industry voices talk about your category.
With social media users in the U.S. projected to reach 330.07 million by 2029, the conversations shaping brand visibility and influence will only get louder.
This is more than counting mentions. SSoV shows which companies are leading the dialogue and which are falling behind.
It helps you gauge the reach of your campaigns, the impact of your partnerships and how quickly your competitors gain traction.
A sudden surge in competitor mentions or a shift in sentiment signals when it is time to adjust your narrative and re-engage your audience before the conversation moves on without you.
14. Net Promoter Score (NPS)
Few metrics reflect brand loyalty as clearly as Net Promoter Score.
Based on a simple question about whether someone would recommend your brand to others, NPS measures the strength of your customer relationships over time.
Unlike satisfaction surveys that capture one-off interactions, this score reflects how people feel about your brand as a whole.
Customer responses fall into three groups. Promoters who score 9 or 10 tend to stay loyal and refer others. Passives, who give a 7 or 8, are generally satisfied but open to alternatives.
Detractors, scoring between 0 and 6, are more likely to leave negative feedback and switch to competitors.
You calculate NPS by subtracting the percentage of detractors from the percentage of promoters.
As a global benchmark, it helps you understand how your customer loyalty stacks up against competitors and whether your brand experience builds long-term advocates.
15. Average Order Value (AOV)
Average order value tracks how much revenue you generate from each transaction. It shows whether your customers are buying single items or building larger orders, giving you a clear view of how purchasing behavior shapes revenue.
As marketing budgets hold steady at 7.7% of overall company revenue in 2025, increasing the value of every order becomes one of the clearest ways to drive growth without raising spend.
Watching this metric before and after a major campaign, new pricing strategy or bundling offer gives a direct read on whether your initiatives drive higher-value purchases.
Over time, raising order value improves margins and builds a more resilient revenue base without the cost of chasing additional traffic.
16. Churn Rate
Keeping the customers you already have is one of the fastest ways to protect revenue, but it’s rarely easy.
As customer retention dropped from 10.5% in Fall 2024 to 7.7% in 2025, many companies are learning how quickly long-term relationships can fade without continuous effort.
Churn rate highlights where those gaps appear and how much recurring revenue slips away when customers leave.
Digital marketing plays a direct role in reducing churn by keeping your brand relevant after the first purchase.
Personalized onboarding, well-timed retention campaigns and smart content strategies help re-engage customers before they drift toward a competitor.
The strongest teams track churn by product and market to focus on the points where interest fades and where the right message or offer keeps customers connected.
17. Pipeline Velocity
Revenue growth depends on how efficiently deals move from early interest to closed business.
Pipeline velocity gives you that view by combining the number of qualified opportunities, their size, your win rate and the speed of your sales cycle.
Even though 82% of marketers in 2024 felt their strategies were effective, pipeline performance often reveals gaps that those top-line confidence numbers miss.
This metric highlights where deals stall and where teams lose valuable time. A healthy pipeline is not only about volume but about keeping the right opportunities moving without delay.
By focusing on where poor qualification, slow follow-up or unclear handoffs slow down progress, marketing and sales teams can prevent revenue from slipping further down the funnel.
The real impact comes from targeting the early stages, improving how teams identify and prioritize strong leads and creating a process where qualified opportunities move to conversion.
Digital Silk’s Digital Marketing Case Studies
Digital Silk applies data-driven marketing strategies to help brands reach the right audiences and drive meaningful growth.
Our experts have helped companies optimize budgets and turn strategic decisions into stronger performance outcomes.
1. AGS Devices
Digital Silk helped AGS Devices shift from a limited digital presence to a scalable lead generation strategy built for long-term growth.

By launching a multi-channel campaign across SEO, LinkedIn Ads and content marketing, the team focused on reaching aerospace, industrial and healthcare manufacturing decision-makers while improving brand visibility and trust.
In just three weeks, organic traffic grew by 80%, LinkedIn cost-per-lead dropped by 48% and account reach expanded by over 3,800%, showing rapid gains in both lead volume and brand engagement.
2. Laser By Aleya
Laser By Aleya partnered with Digital Silk to strengthen their local visibility and build a more consistent lead generation engine in the competitive New York market.

The team restructured their digital approach, combining always-on Meta Ads with a focused local SEO strategy targeting high-intent search terms.
Over six months, organic sessions grew by 70%, cost-per-lead dropped by 27% and the brand secured over 260 keyword rankings in the top 20 search positions.
This approach helped Laser By Aleya establish a sustainable growth path and connect with more qualified local customers.
Lift Your KPIs With Predictive Analytics & Data Quality
To future-proof your KPI framework, you need predictive analytics and clean, reliable data.
Predictive models (e.g. churn scoring, LTV forecasting) turn KPIs into proactive decision tools.
You can use the following strategies:
- Ensure data hygiene: Eliminate duplicates, filter bots and standardize naming conventions across platforms.
- Use predictive tools: Platforms like Google Analytics 4, Tableau or Snowflake can forecast key metrics like LTV, churn and conversion likelihood.
- Set data-quality KPIs: Monitor data freshness, integration reliability and error rates to safeguard your insights.
Adding predictive layers transforms retrospective dashboards into strategic playbooks for growth.
How To Implement & Track Digital Marketing KPIs In 2026
To turn digital marketing KPIs and metrics into meaningful results, you need more than dashboards and reports.
Clear priorities, practical tools and the ability to act on insights quickly to translate metrics into revenue growth.
The sections below outline how to connect your KPIs to business goals, choose the right platforms and use automation to keep your teams moving at speed.
1. Aligning KPIs With Business Objectives
Essential KPIs for digital marketing should answer one question: how does this drive revenue, margin or market share.
Customer acquisition cost, lifetime value and pipeline velocity are where marketing and business goals meet.
Finance, IT and regional leads should meet regularly to review these numbers and adjust budgets or priorities based on facts, not assumptions. This turns your KPI framework into a decision-making tool, not just a scorecard.
However, KPIs only drive decisions when grounded in benchmarks and aligned with your organizational hierarchy.
Best practices include:
- Benchmark KPIs against internal cohorts and industry standards (e.g., CAC, LTV, ROAS by vertical).
- Organize KPI reporting across levels, including campaign, channel, regional and company-wide.
- Ensure alignment between marketing and finance with clear roll-up logic.
2. Recommended Tools And Technology Stacks
Your platform choices should support your digital marketing KPIs and metrics to give you a complete view of performance.
Google Analytics 4 and Looker Studio track what happens on your site, Salesforce Marketing Cloud helps manage customer journeys and Tableau turns data into fast executive insights.
As privacy regulations tighten (GDPR, CCPA, ePrivacy), tracking infrastructure must adapt to protect both users and insights.
The steps you can take include:
- Use consent management platforms (CMPs) to ensure legal tracking.
- Implement server-side tagging or hybrid analytics to bypass cookie restrictions without violating compliance.
- Anonymize Personally Identifiable Information (PII) and conduct quarterly audits to reduce legal and financial risk.
Compliance-first measurement ensures your data remains reliable and legally usable as regulations evolve.
3. Integrating AI And Automation In KPI Tracking
75% of businesses now use some form of marketing automation, and the smartest teams use it to speed up decisions, not replace them.
AI tools like Google Performance Max adjust campaigns in real time, shifting spend and creative when performance trends change. This replaces manual reporting cycles with predictive signals that keep campaigns moving in the right direction.
Common Challenges When Tracking Digital Marketing KPIs
Dashboards alone won’t drive growth if the insights behind them are shallow or incomplete.
The most common failures in measuring digital marketing KPIs happen when teams chase the wrong metrics or build disconnected views of performance.
Focusing On Vanity Metrics
Metrics like follower counts and likes may show activity but rarely translate into revenue. They give teams something to celebrate, but they do little to guide meaningful business decisions.
Every metric should help move the business forward. The most valuable KPIs of digital marketing reveal where your campaigns are driving measurable outcomes.
If they don’t, they belong lower on the dashboard or off of it entirely.
Allowing Data Silos To Persist
When business units and regions track performance in isolation, leadership loses sight of the full customer journey.
Separate tools and disconnected reports hide how marketing drives pipeline and revenue across channels.
Fixing this means connecting your platforms so teams see one version of the truth.
Track where integration shortens reporting cycles, improves forecasting or sharpens budget allocation so the impact is clear at every level of the business.
Build Data-Driven Marketing Strategies With Digital Silk
Growth happens when companies focus on the most important digital marketing KPIs and metrics that reflect real progress, not surface-level activity.
The right strategy turns data into better decisions on where to spend, what to improve and how to scale.
Digital Silk’s expert team helps businesses build data-driven strategies that improve pipeline velocity, lower acquisition costs and grow revenue from the customers who matter most.
As a professional digital marketing agency, our services include:
- Digital marketing solutions
- SEO services
- Social media marketing
- eCommerce PPC
- Custom web design
- Branding services
Digital Silk leads each project with hands-on management and clear communication, ensuring every step drives measurable outcomes and real business value.
Contact our team, call us at (800) 206-9413 or fill in the Request a Quote form below to schedule a consultation.
"*" indicates required fields


