Mobile UX Performance Statistics: Key Highlights
-
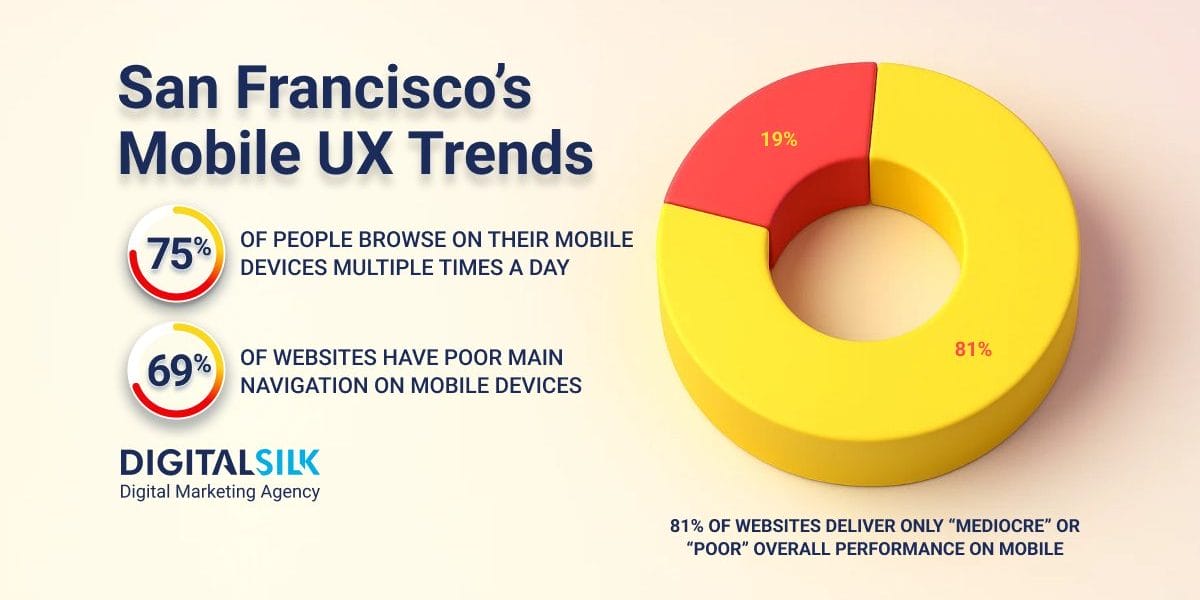
81% of websites still deliver poor or mediocre mobile performance, leaving major conversion opportunities untapped.
-
Only 53.5% of mobile sites meet Google’s Core Web Vitals, showing that speed and responsiveness remain critical weaknesses.
-
Every $1 invested in UX delivers a return of $100, confirming that performance optimization directly drives business growth.
San Francisco has become the ultimate testing ground for mobile experience, where user expectations shift faster than most brands can adapt.
As of September 2025, mobile makes up 44.29% of total U.S. traffic, still slightly behind desktop but steadily climbing as users spend more time and money on their phones.
For brands operating in a city where digital standards are high, the quality of a mobile experience can directly influence loyalty and revenue.
This post explores the latest mobile UX performance statistics and examines how they relate to San Francisco’s unique digital environment, uncovering what’s driving user engagement and where businesses can improve.
General Mobile UX Performance Stats
While the following figures reflect global trends, they provide valuable context for understanding mobile UX statistics in San Francisco, where innovation often amplifies both the strengths and weaknesses seen elsewhere.
These insights help frame how local brands approach usability, design tools and performance in a market defined by high user expectations.
- 81% of websites deliver only “mediocre” or “poor” overall performance on mobile devices.
- 75% of mobile sites incorrectly implement product types with shared attributes as separate categories.
- Across homepage and category navigation, main navigation on mobile remains the weakest area, with 69% of benchmarked sites underperforming.
- 48% of sites fall into the “very poor” category for touch interface performance.
- Mobile site speed benchmarks indicate that only 53.5% of websites meet Google’s Core Web Vitals requirements as of August 2025.
- For the fourth consecutive year, 72% of designers select Figma as their go-to tool for wireframing and prototyping.
- ChatGPT is the top AI tool use in UX workflows, with 77% of designers including it in their process.
- 71.6% of industry members believe that AI and machine learning will define the future of UX design.
- 50% of professionals incorporate Google Analytics into their workflow to track and measure user behavior.
What This Means For Mobile UX Benchmarks In San Francisco
- Mediocre mobile experiences are costing conversions. With most sites underperforming, local brands need to treat mobile website performance statistics as a business risk, not a design flaw.
- Navigation deserves more attention. Simplifying the user journey from discovery to purchase should be a priority since confusing structures directly affect engagement and retention.
- Touch interaction defines perception. Investing in smoother, more responsive interfaces pays off quickly in markets like San Francisco, where users expect near-instant feedback.
Mobile User Experience Performance And Consumer Behavior
The latest mobile user experience stats reveal that longer sessions don’t always mean better engagement.
Users are spending more time on mobile but continue to face friction from unresponsive elements, confusing navigation and frequent errors.
These changes illustrate that sustained attention doesn’t equal satisfaction and improving mobile usability remains a major opportunity for growth.
- In 2025, mobile session duration skyrocketed to 15 minutes and 51 seconds, rising 332% from the previous year’s 3 minutes and 40 seconds.
- Scroll depth has slipped to 67% in 2025 despite longer sessions, suggesting users spend more time on-site but explore less.
- Frustration has intensified, as mobile rage clicks, which refers to users rapidly tapping in irritation, rose 15.6% while exits after error increased 29% in 2025.
- Dead clicks remain alarmingly high, averaging 929 per 1,000 mobile sessions, meaning users encounter unresponsive elements almost every visit.
- While 75% of people browse on their mobile devices multiple times a day, only 26% make daily purchases on their phones.
- 69% of consumers research high-value items on mobile but complete their purchases on desktop.
- 43% of users say mobile errors create inaccuracies or roadblocks in their experience.
- Only 39% of consumers complete their full purchase on mobile, with most using it for everyday shopping.
- In 2024, 55.3% of consumers reported preferring mobile apps for online shopping, far outpacing the 22.5% who preferred mobile websites.
- U.S. consumers show growing distrust, as 27% believe brands neglect mobile user protection, representing a 337% surge and the highest rate globally.
What This Means For Mobile UX Benchmarks In San Francisco
- Longer sessions don’t guarantee progress. While users are spending more time on mobile, they often fail to find what they need or complete intended actions, highlighting the importance of mobile UI performance in SF companies.
- User frustration is a major growth blocker. High levels of rage and dead clicks indicate unresolved usability issues that keep customers from staying engaged.
- Apps are setting higher expectations. As users increasingly prefer app-based shopping, websites need to deliver comparable speed, responsiveness and ease of use.
Mobile UX Performance Metrics And ROI
Mobile UX performance data shows a clear link between user experience and revenue, but the gap between engagement and conversion remains wide.
High cart abandonment rates and modest order values suggest that design improvements alone aren’t enough without in-depth behavioral understanding.
These numbers remind San Francisco businesses that better experiences attract users, keep them engaged and ultimately build lasting brand trust.
- Every $1 invested in UX delivers a return of $100, giving an ROI of 9,900%.
- In September 2025, the average eCommerce conversion rate on mobile was 2.72%.
- The data for September 2025 shows a 6.19% add-to-cart rate and an 82.37% cart abandonment rate among mobile users.
- In that same month, mobile users made an average of 0.14 transactions each, with an average order value of $132.
- The average bounce rate on mobile is 49.1%, compared to desktop’s 47.3%.
- In 2025, the food and beverage industry recorded the highest bounce rate on mobile at 52.86%.
What This Means For Mobile UX Benchmarks In San Francisco
- Engagement needs a finish line. Longer sessions and frequent cart additions matter only when they lead to completed transactions.
- Performance defines competitiveness. Findings from mobile site performance metrics suggest that the fastest, most seamless experiences are now the baseline, not a differentiator.
- Abandonment reflects uncertainty. High cart drop-off rates show that checkout design and messaging need to reinforce trust and reduce hesitation.
Digital Silk’s San Francisco Website Example
CrawlSF faced major challenges with poor mobile usability and the risk of losing hard-earned SEO performance during their website redesign.

Digital Silk reimagined the site with a mobile-first approach, creating a faster, more intuitive experience that made event discovery effortless on any device.
Our team improved navigation, readability and responsiveness to keep users engaged while preserving search visibility.
The results included a 23% increase in users and a 213% boost in average session duration, proving the impact of stronger mobile UX design.
Best Practices For Mobile Design Performance In San Francisco
Mobile design in San Francisco prioritizes usability, performance and real-world testing.
Insights from mobile UX performance statistics show that even small design flaws can have a major impact on engagement and conversions.
The best practices below outline how you can create mobile experiences that meet user expectations and perform consistently across devices:
- Organizing content to fit smaller screens: Prioritize essential information and structure layouts around user goals. Use single-column designs, clear hierarchy and adequate white space to guide attention and improve readability.
- Designing for touch interactions: Ensure tap targets are large enough to prevent errors and space them to avoid accidental taps. Include intuitive gestures like swiping or pinching, with responsive visual feedback for every action.
- Optimizing for speed and performance: Compress images, combine files where possible and implement caching or lazy loading to reduce load times and improve responsiveness.
- Maintaining visual stability: Prevent elements from shifting while loading to maintain a smooth, consistent experience that builds trust.
- Ensuring accessibility from the start: Use legible text, compliant color contrast and structured headings to make content usable across devices, lighting conditions and assistive technologies.
- Testing in real environments: Evaluate performance on different devices, screen sizes and connection speeds to ensure consistency under real-world conditions.
Optimize Your San Francisco Website With Digital Silk
Mobile design reflects how effectively a brand connects with its audience and anticipates user needs.
In San Francisco’s fast-moving digital market, every interaction influences how customers perceive value and trust.
Digital Silk’s San Francisco team partners with forward-thinking brands to transform mobile UX performance into a measurable growth engine.
Our award-winning designers and developers create interfaces that load faster, feel smoother and convert better, supported by real-time analytics and ongoing optimization.
As a professional web design agency, our services include:
Our approach centers on transparent communication and strategic oversight, to keep every partnership results-oriented.
Contact our team, call us at (800) 206-9413 or fill in the Request a Quote form below to schedule a consultation.
"*" indicates required fields


